Greater Toronto Area Rental Market
The following chart looks at the average asking rent data from TorontoRentals.com listings in the Greater Toronto Area (GTA).
Monthly Asking Rent and Monthly Change in Rent for All Property Types
The chart below looks at the average rent for all property types by month since the start of 2019 (blue line – left axis), with the monthly change in average rent represented by the red bars.
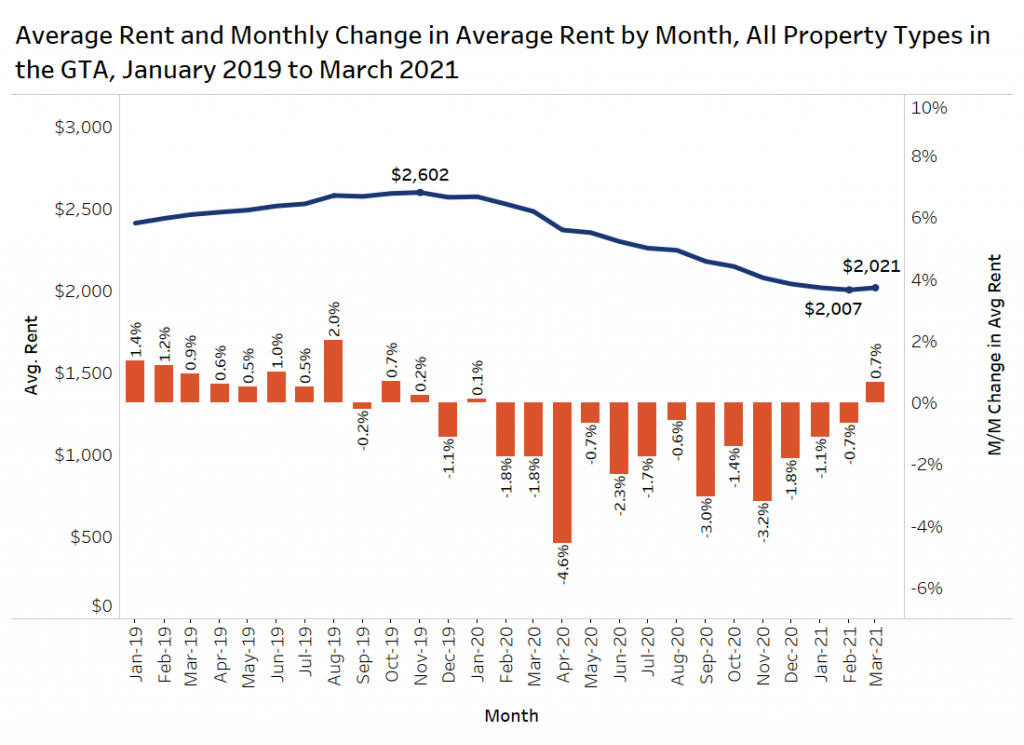
For the first time since January 2020, the average GTA rent increased month over month, rising from $2,007 to $2,021. However, the average rent is still down 19% annually.
This is the first sign that the rental market in the GTA may have hit bottom and may start trending back upward.
Quarterly Rent Levels by Property Type
The figure below presents GTA data on the average rent and average rent per square foot for single-family homes, condominium apartments, and rental apartments by quarter from the start of 2020 to the end of March 2021 via TorontoRentals.com listings data.
Single-family homes are being offered at 10% less in Q1-2021 in comparison to Q1-2020 at $2,510 per month. The average rent per square foot (psf) for single-family homes is $1.82, down slightly from $1.87 psf during the same quarter last year.
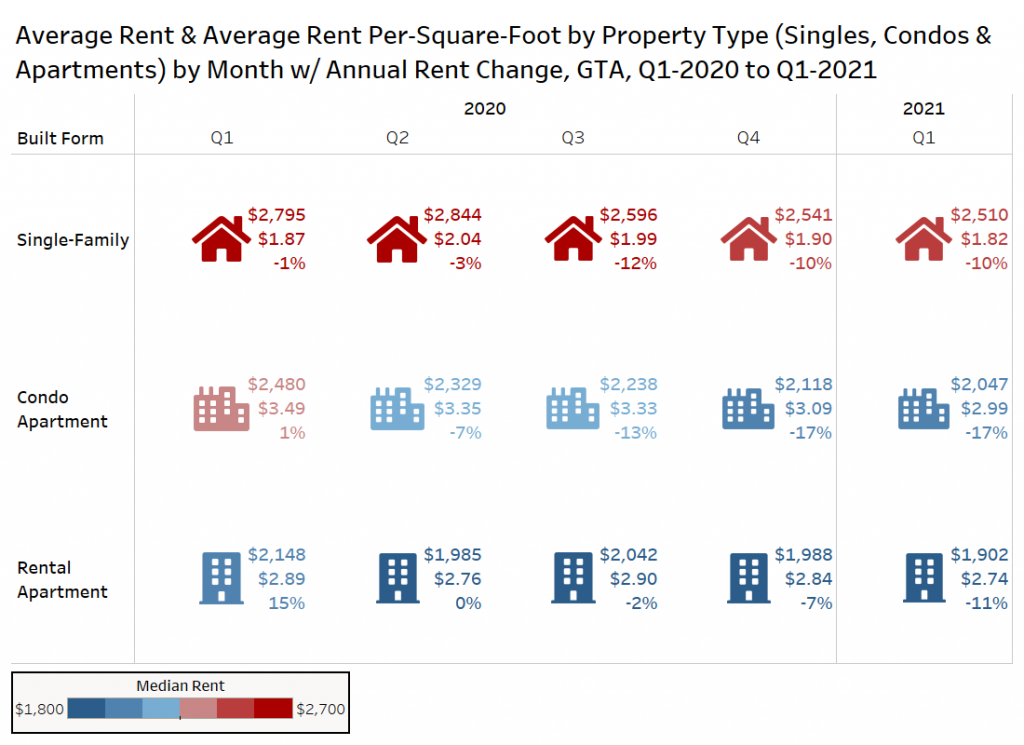
Condo apartments have been impacted the most, with an annual decline of 17%, falling from $2,480 per month in Q1-2020 to $2,047 per month in Q1-2021.
Tenants looking for rental apartments will be saving nearly $250 in rent in the first quarter of this year compared to Q1-2020, with rent falling from $2,148 per month last year to $1,902 per month in Q1-2021.
Monthly Asking Rent and Monthly Change in Rent for Condominium and Rental Apartments
The next chart looks at condominium and rental apartments only, tracking the average monthly rent versus the month-over-month change in that average rent. This chart only looks at the last 13 months of data.
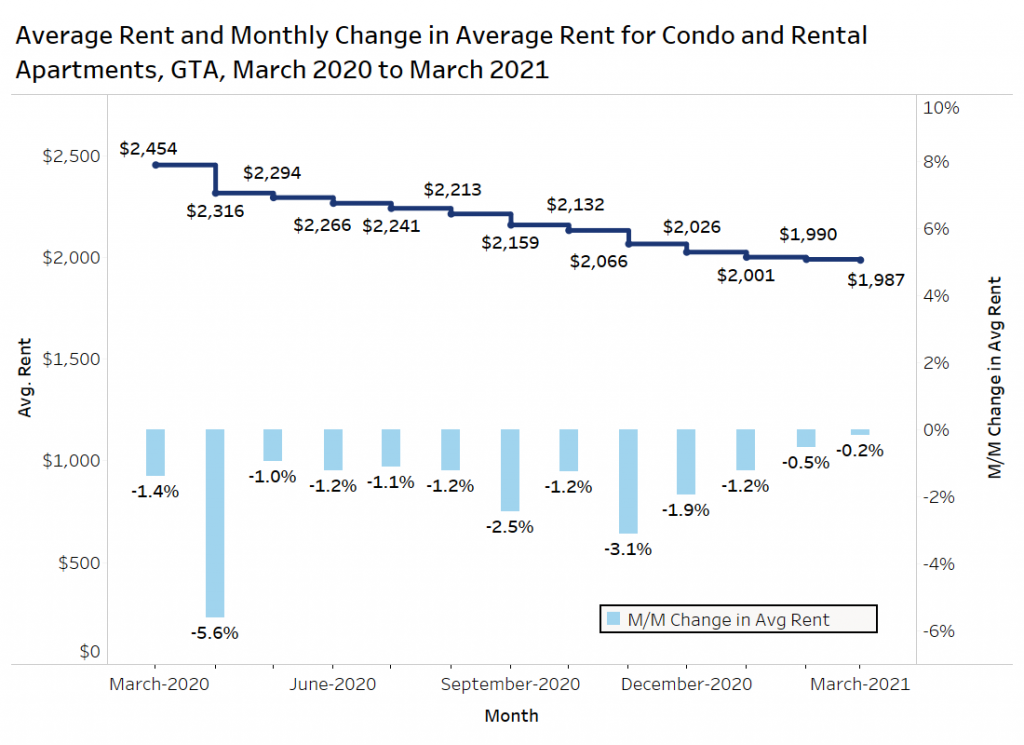
The average rent for condominium apartments and rental apartments in the GTA in March 2021 was $1,987 per month, which is also an annual decline of 19%. The month-over-month decline in average rent has primarily been in the range of -1.0% to -2.0%. The greatest decline in month-over-month average rent was 5.6%, early in the pandemic in April 2020 when the country was in a very strict lockdown, and people were scared to leave their homes.
The average rent was at its lowest level over the past year in March 2021, experiencing a month-over-month decline of 0.2%. The monthly decline of 0.2% was the lowest since the start of the pandemic.
Average Rent Per-Square-Foot by Apartment Tenure
The chart below plots the average rent per square foot for condominium and rental apartments in the GTA from Q1-2020 to Q1-2021. Please note that not all units listed on TorontoRentals.com have their suite size listed, so this data is a straight average of the units where data is available. The results likely skew high, as newer buildings are more likely to have their unit sizes known to landlords and/or owners.
The average rent per square foot for condos has declined from approximately $3.02 in Q1-2020 down to $2.76 psf in Q1-2021 in the GTA, an annual decline of 9%.
The average rent per square foot for rental apartments in Q1-2021 was $2.44 psf, which is slightly higher than the Q1-2020 average rent per square foot of $2.42 psf.
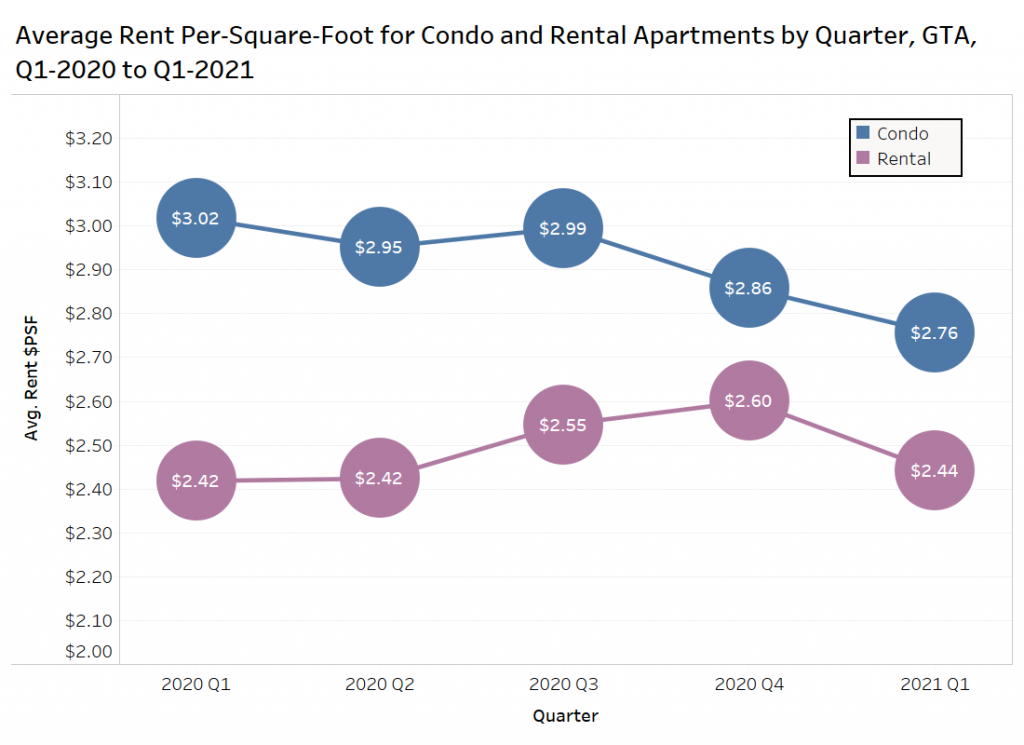
However, it is worth mentioning that these are asking rents. There have been more listings for smaller suites sitting on the market than ever before, and since small units typically have higher per-foot rental rates, unit size is a contributing factor to the rents per square foot not being lower.
Average Rent by Quarter and Bedroom Type by Apartment Tenure
In the figure below, the average rent for condominium and rental apartments in the GTA from Q1-2020 to Q1-2021 is shown, with the data broken out by bedroom type. The dashed grey line represents the linear trendline.
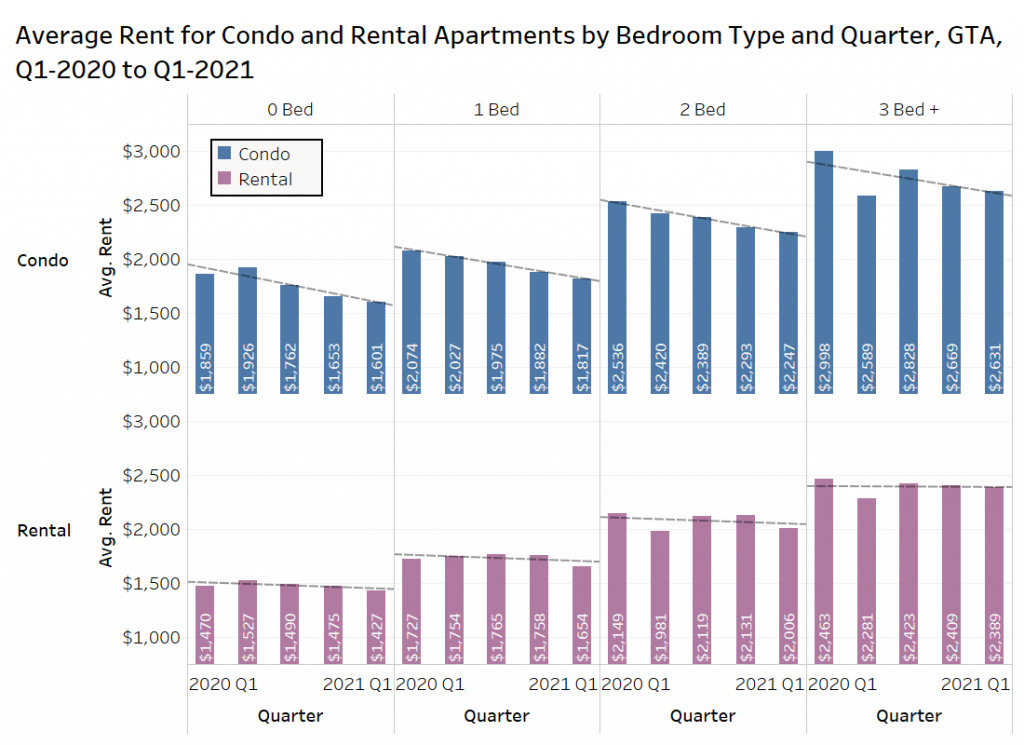
One-bedroom and two-bedroom condos saw their average rental rates consistently decline each quarter. One-bedroom condos have declined by 12% annually, while the two-bedroom units are down 11% annually. These are the most representative of overall market conditions due to large sample sizes.
The average rental rates for rental apartments have also declined between Q1-2020 and Q1-2021, though at a lesser rate. The average rent for rental apartments are lower than the average rent for condo units of the same bedroom type, primarily due to the age of the buildings. One-bedroom apartments are down 4% annually, while two-bedroom units are down 7% annually.
Keep in mind that there are several buildings offering rental incentives in 2021, and those incentives are not netted out of the average rental rates.
Average Rent and Annual Change in Average Rent by Municipality
The map below shows the average rent, annual change in average rent and average unit size for condominium and rental apartments by municipality (and former municipality) in the GTA in the first quarter of 2021.
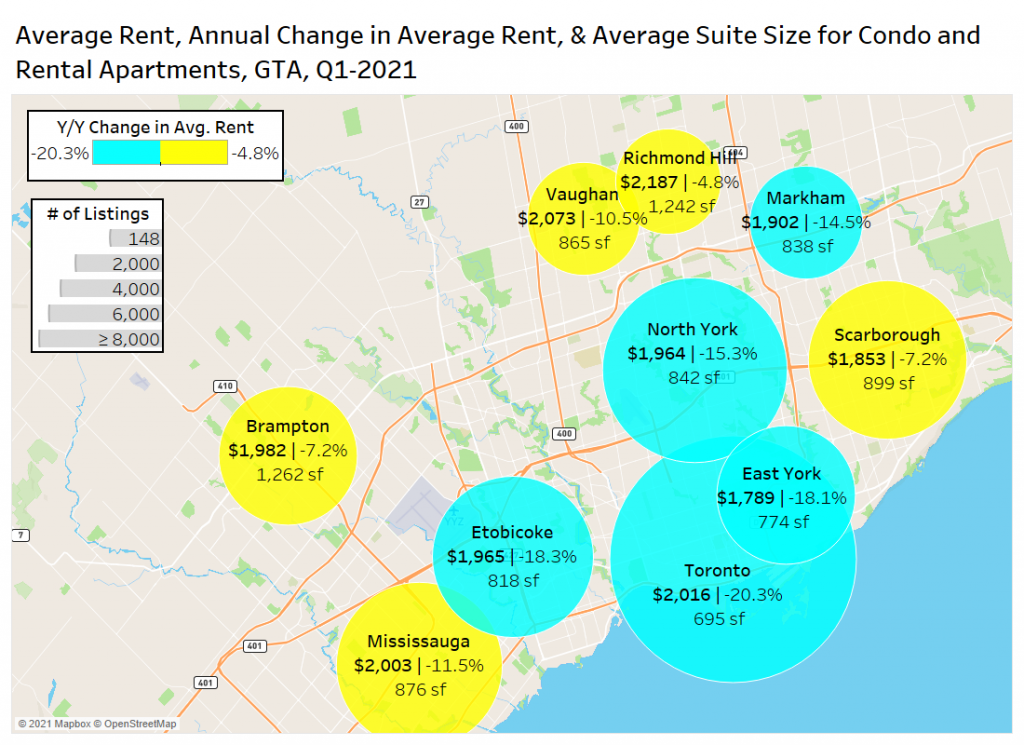
Toronto rents are down 20% annually to $2,016 per month, while Etobicoke and East York both experienced declines of 18%. North York dropped 15%, as did Markham. Both Vaughan and Mississauga are down by around 11% year-over-year.
Sample sizes are much smaller in the outer suburban markets, and the unit sizes are larger, so the results can be volatile on a monthly and quarterly basis based on the composition of listings. The larger the circle, the bigger the sample size and the more reliable the results as a measure of market demand/supply.
Average rents are higher in Vaughan and Richmond Hill in comparison to Toronto.
GTA Listing Locations
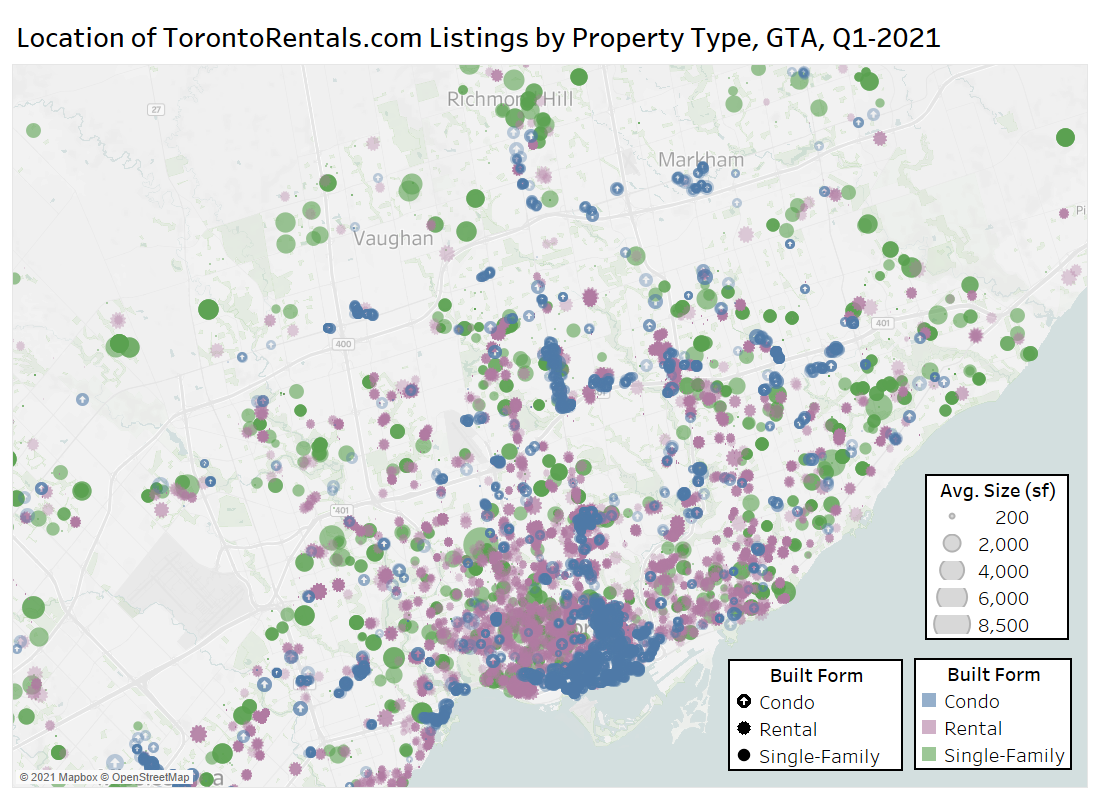
The map below shows the location of the TorontoRentals.com listings reviewed in this quarter, with the colour corresponding to the property type (singles, condos, and rental apartments only), and the size of the markers reflecting the average unit size of that location.
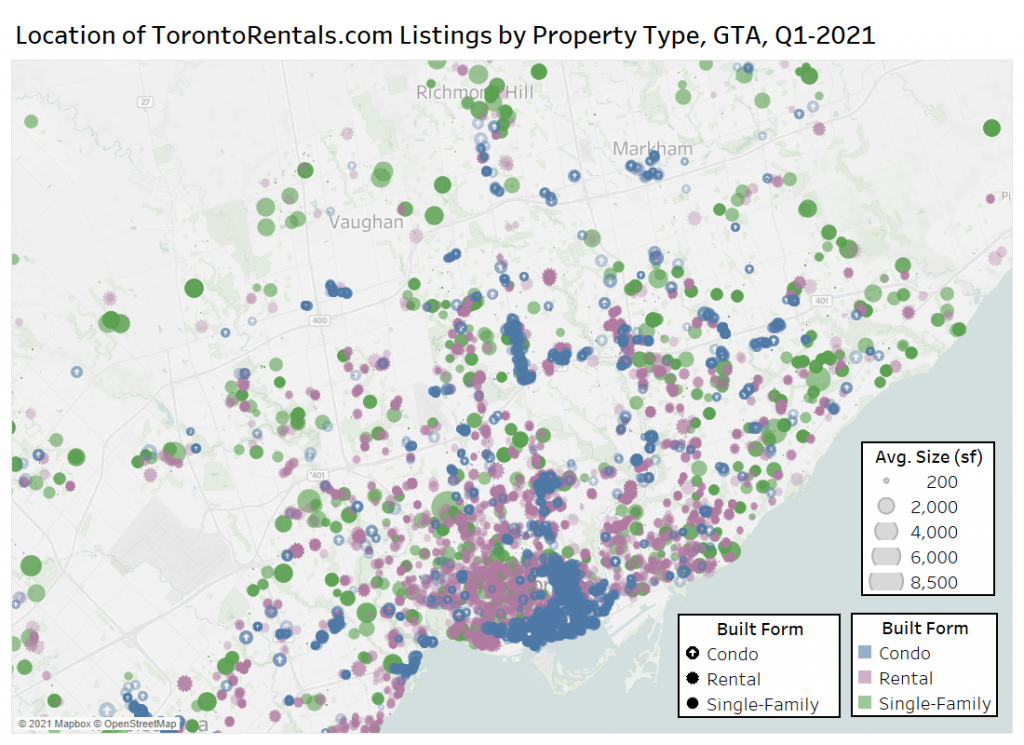
Condo listings are generally concentrated in a select few clusters, demonstrated by a large grouping of blue markers in downtown Toronto and near the waterfront, as well as the smaller condo clusters slightly north of downtown Toronto along the Yonge subway line into the North York City Centre. Going west, there are a number of condo buildings along the waterfront and a cluster of buildings in the Mississauga City Centre. It is worth noting that the first condo registered in the GTA was in 1968.
Rental apartments are more evenly spread out throughout the GTA, demonstrated by the dispersed nature of the purple markers.
The green single-family markers are concentrated in the ‘outer-416’ market and inner suburbs. The largest unit for rent in Q1-2021 was 8,500 square feet, with the smallest being just 200 square feet.
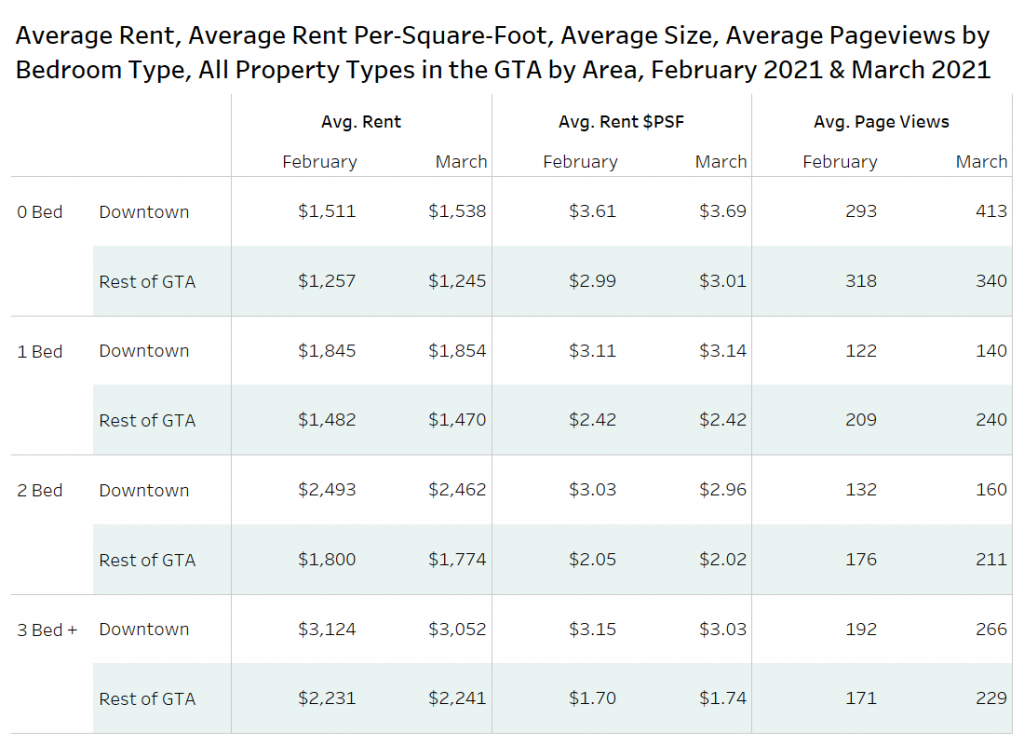
Summary Data on February and March Rental Data by Bedroom Type and Area
Overall, the average number of pageviews for a listing was higher in March 2021 compared to February 2021 for units of all bedroom types both downtown and in the rest of the GTA. Part of the rise can be attributed to the typically more active spring market, but it is clear that demand is picking up.
The most notable change in average rent was experienced by three-bedroom units downtown, moving from $3,214 per month in February 2021 down to $3,052 per month in March 2021 (small sample size).
For the more common bedroom types, studio and one-bedroom suites saw rent increases downtown, but two-bedroom rents fell. Studio, one- and two-bedroom suites outside the downtown area of Toronto in the GTA saw average rents drop.
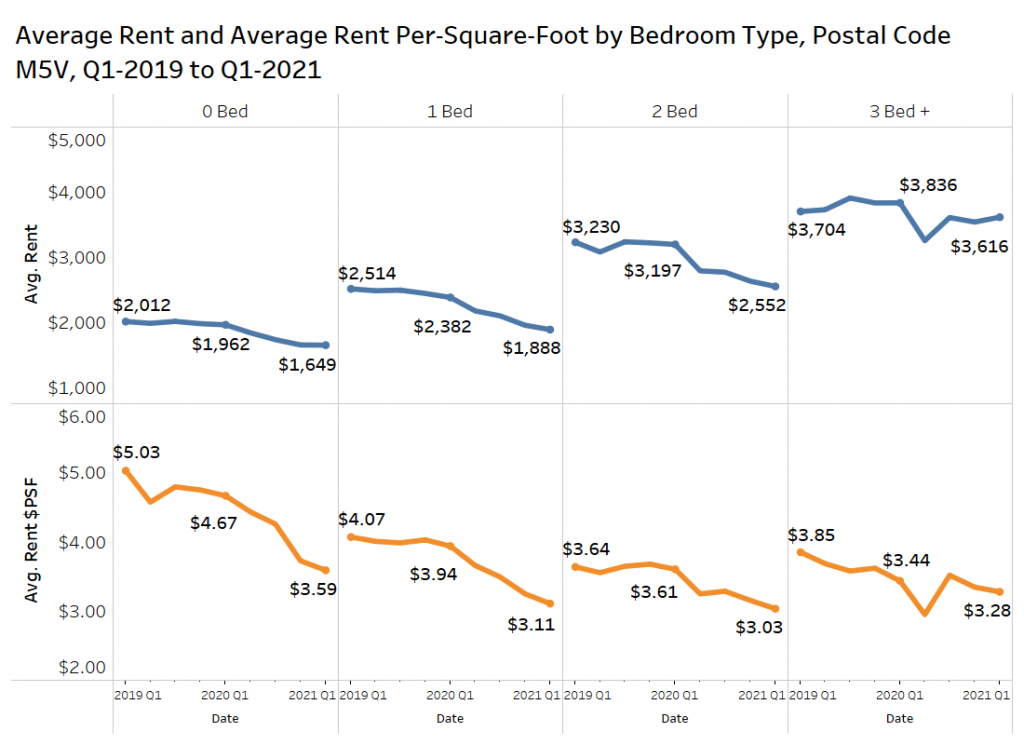
Postal Code M5V in Downtown Toronto
The most active postal code for rental activity in the GTA is M5V in Toronto’s downtown west area. The chart below shows market data over the past two years in that geographic area.
The average rent has declined annually in Q1-2020 and Q1-2021 for nearly all bedroom types. Units with three or more bedrooms were the only unit type to experience an annual increase in average rent (in Q1-2020). The average rent for one-bedroom units experienced the largest decrease over this two-year period, declining nearly 25% from $2,514 to $1,888 per month.
The average rent per square foot experienced something similar, declining for all bedroom types since 2019. Studio units saw their average rent per square foot experience the largest decline, decreasing 29% from $5.03 psf down to $3.59 psf.
Conclusion
After a tumultuous year of lockdowns that saw the average rental rate decrease by over 20% annually, March 2021 saw the first month-over-month increase in the average GTA rent level in over a year, suggesting that February might have been the market bottom.
In the GTA, condominium units are the property type that has experienced the largest annual decrease in average rent, declining by 17%. By comparison, rental apartments decreased 11% year over year, while single-family homes decreased by 10% year over year.
When looking at the combined data for condo and rental apartments in the GTA, their average rental rate has declined in each month of the pandemic. Therefore, it is not a foregone conclusion that rental rates will rise moving forward. There are a significant number of new units under construction, which will add supply to an already soft market.
The average number of page views for all property types in the GTA were higher in March 2021 compared to February 2021, so prospective tenants are at least seeing what is out there to lease, and potentially trying to time the market and do their research on the wide range of incentives currently being offered.