Greater Toronto Area Rental Market
The following charts look at the summary data based on TorontoRentals.com residential rental listings in the Greater Toronto Area (GTA).
Monthly Asking Rent and Monthly Change in Rent for All Property Types
The chart below looks at the average rent for all property types by month since the start of 2020 (blue line – left axis), with the monthly change in average rent represented by the yellow bars.
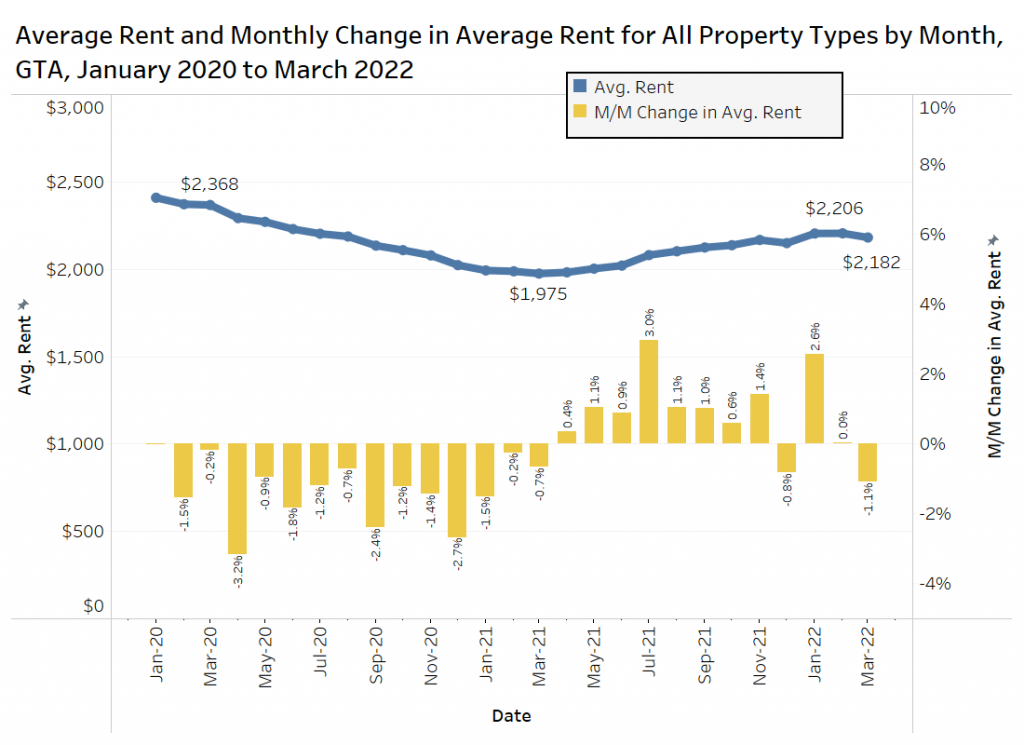
The average monthly rental rate declined every month from January 2020 to March 2021. Since April 2021, the average rent has increased month over month for 10 of the last 12 months as the rental market trends back up from the pandemic-related shake-up.
The March 2022 rent was at $2,182 on average, which represents an annual increase of 10% from $1,975 per month in March 2021. As shown in the chart above, the average monthly rent declined in March of this year by 1.1% from February.
Monthly Asking Rent and Monthly Change in Rent for Condominium and Rental Apartments
An average can often be skewed by a changing composition of units, as the sample of listings on Rentals.ca is not consistent from month to month. To try to control for some of these sampling issues, the following chart will look at just two of the property types.
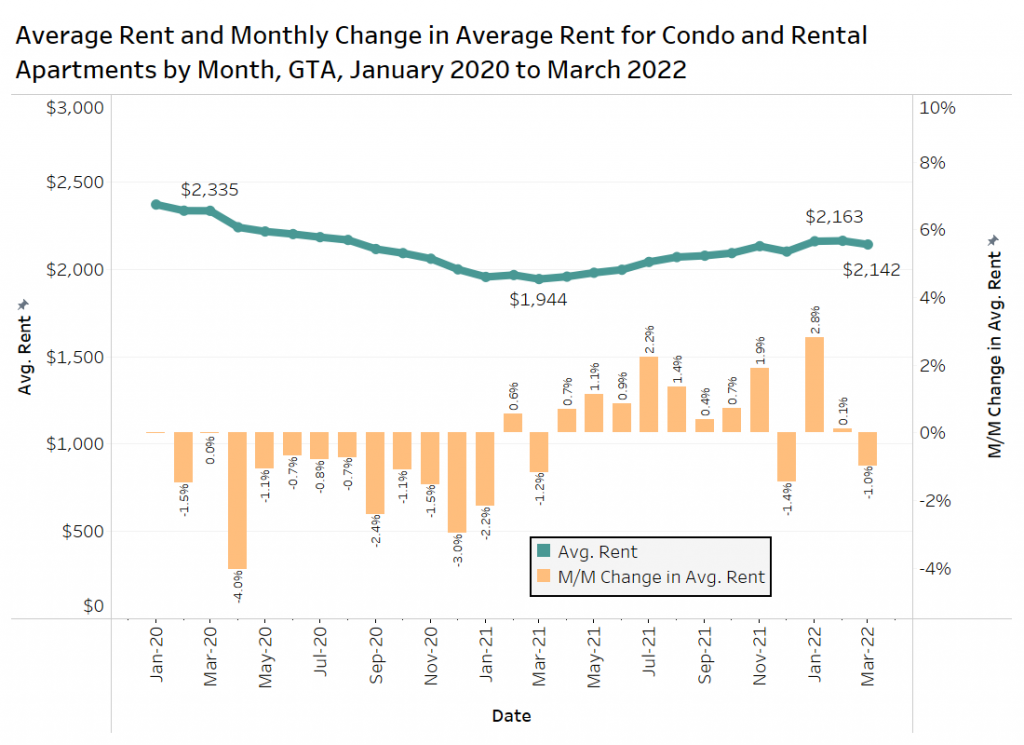
The average rent for all condominium and rental apartments by month, along with the monthly change in average rent since January 2020.
Condo and rental apartments in March 2022 had an average monthly rental rate of $2,142 per month, representing a monthly change in average monthly rental rate of -1%.
Average Rent and Average Rent Per-Square-Foot for Condominium Apartments, Rental Apartments, and Single-Family Houses by Quarter
This figure below shows the average rent and average rent per-square-foot for condos, rental apartments, and single-family homes in the GTA by quarter from Q1-2020 to Q2-2022.
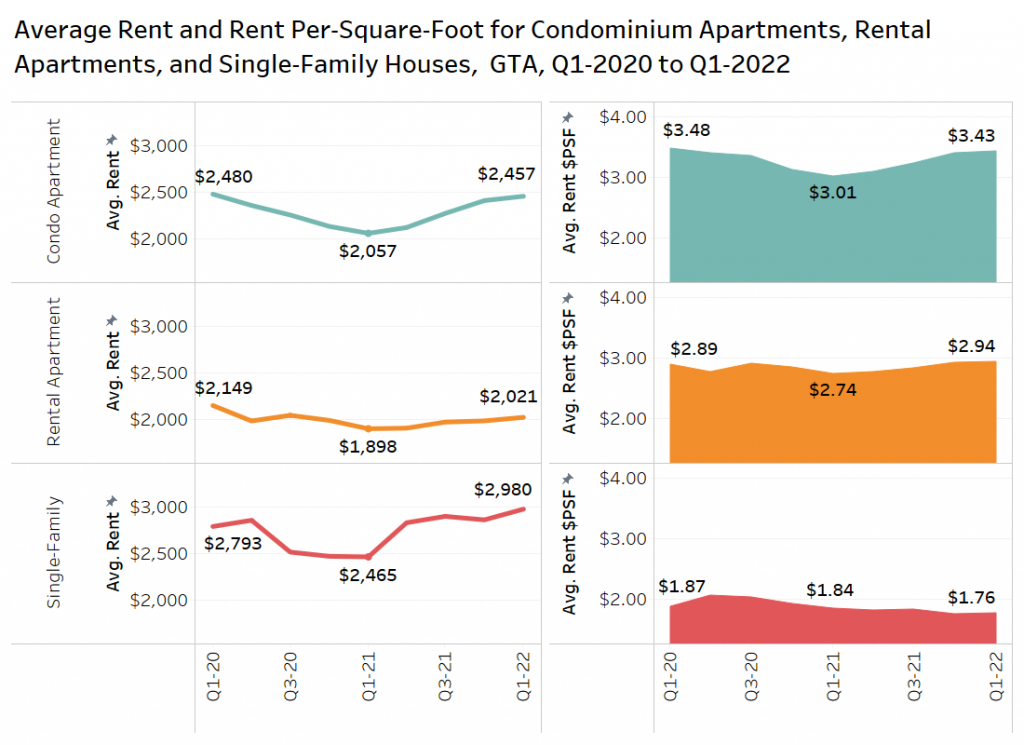
The average rent for condo apartments was $2,480 per month in Q1-2020, declining significantly over the next year (-17% Y/Y) before increasing to $2,457 per month in Q1-2022. The average rent per-square-foot has followed a similar path, moving from $3.48 in Q1-2020 to $3.43 in Q1-2022 with a noticeable dip in the first quarter of 2021 to $3.01 per-square-foot.
The average rent for traditional rental apartments was $2,149 per month in Q1-2020, slowly declining in 2021 to $1,898 before rising to $2,021 per month in Q1-2022. The average rent per-square-foot has remained fairly stable, moving from $2.89 in Q1-2020 to $2.74 in Q1-2021, to $2.94 in Q1-2022. However, it should be noted that landlords offered a number of incentives last year, including up to two months free rent, which is not netted out of these figures.
The average rent for single-family homes was $2,793 per month in Q1-2020, before also experiencing a significant decline in the latter half of 2020 and the start of 2021 before recovering handily to sit at $2,980 per month in Q1-2022 (+21% Y/Y). The average rent per-square-foot actually fell from $1.87 in Q1-2020 to $1.76 in Q1-2022 as the average detached house for rent rose from 1,691 square feet in size to 1,794 square feet in the first quarter of this year.
Average Rent for Condos and Rental Apartments by Bedroom Type
The figure below presents the average monthly rental rate for condos and rental apartments in the GTA by bedroom type between January 2021 and March 2022.
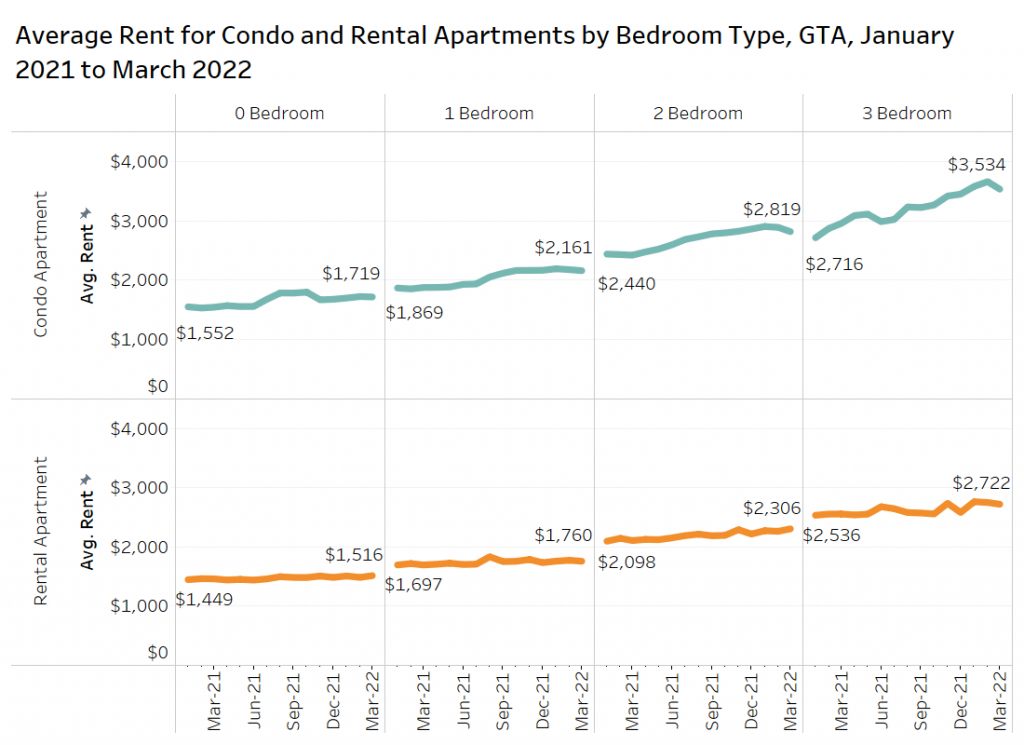
In general, the average rent for condo apartments has experienced more growth since 2021 across all bedroom types in comparison to rental apartments.
The most notable increase for condo apartments has been for three-bedroom units, which saw average rent move from $2,716 per month in January 2021 to $3,534 per month in March 2022 (an increase of 30%, with 20% over the last year). The most notable increase for rental apartments was found in two-bedroom units, where the average rent has moved from $2,098 per month in January 2021 to $2,306 per month in March 2022 (an increase of 10%, with growth of 9% annually).
Average Rent and Average Rent Per-Square-Foot in Toronto and the Rest of the GTA by Bedroom Type
The figure below presents the average rent and the average rent per-square-foot in Old Toronto (pre-amalgamation boundaries and the rest of the GTA by bedroom type in March of 2019, 2020, 2021, and the first two months of this year. The data covers all property types.
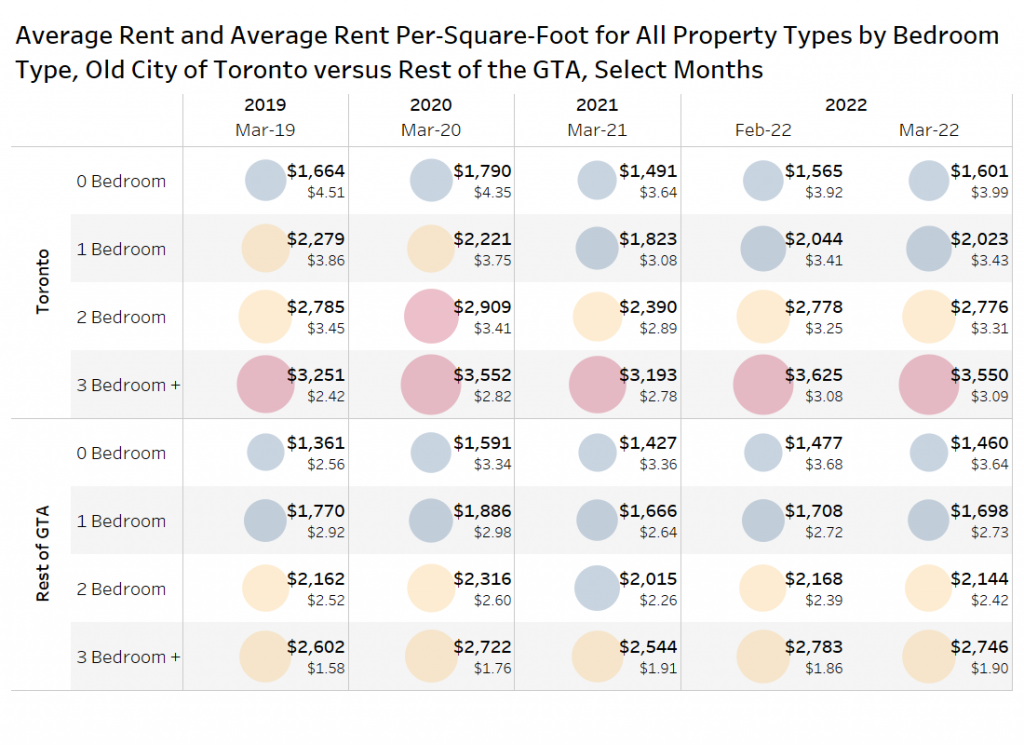
Month over month, there is little change in rents by bedroom type and area. When comparing March 2022 to March 2021, studio units in Toronto were the only market segment that experienced an increase in average rent, increasing by 2.3%. The rest of the market experienced month-over-month declines ranging between -0.1% and -2.1%.
Going back to March of 2019, several bedroom types remain below the rates from three years ago with the exception of studio apartments and three-bedroom or larger condos and apartments. One-bedroom units are still down by 11% compared to 2019 falling from $2,279 to $2,023 per month in Toronto.
Average Rent for Condos and Rental Apartments in Select Municipalities
The figure below presents the average rent for condo and rental apartments in select municipalities in the GTA between Q1-2020 and Q1-2022 along with the difference in monthly rental rates between the two property types.
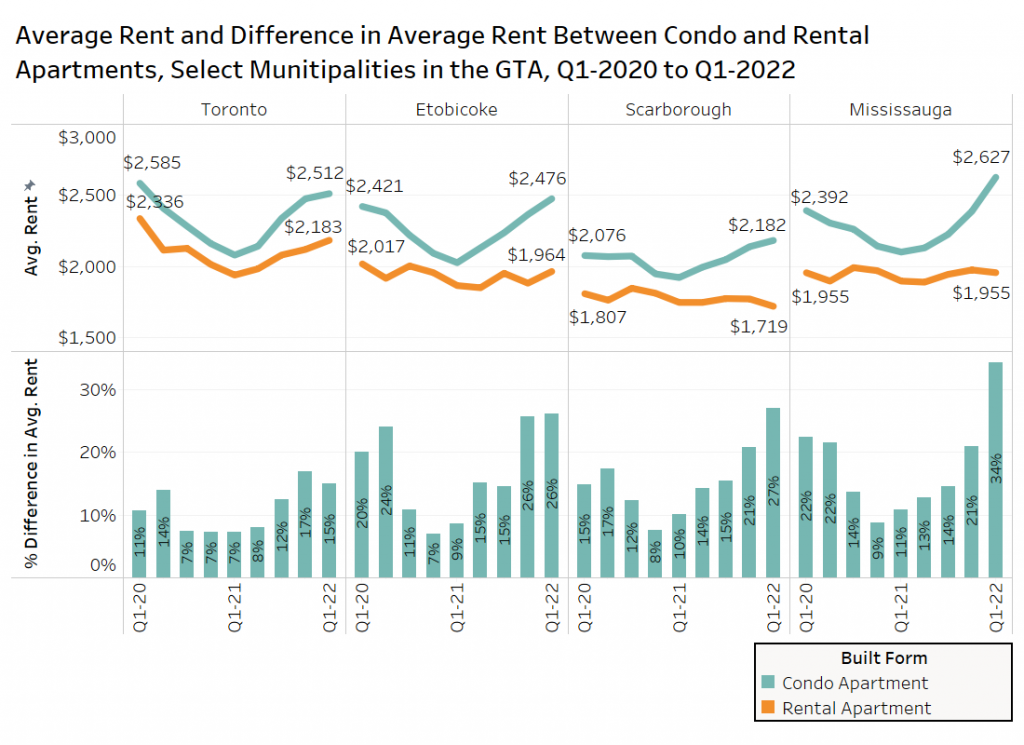
Overall, condos consistently had a higher average monthly rental rate than rental apartments, as the bulk of the rental apartments were built between the 1950s and 1970s, while the bulk of the stock of condominium apartments have been built since the mid-1990s. In general, the price growth of condos has outpaced that of rental apartments over the past year, with condos in Mississauga having an average rental rate 34% higher than the average rental rate of rental apartments in Mississauga.
Toronto is the only market with a lot of purpose-built rental apartment activity, and the condo premium is lower. There have been no new high-rise rental apartments built in Scarborough that didn’t receive some government or charitable funding. Condos have a premium of 27% in Q1-2020 in the former City of Scarborough.
The premium for condos over rental apartments also declined during the pandemic as demand for expensive prime condo projects close to employment plummeted. The premium has risen again as employees return to offices and their places of employment.
Municipality Summary
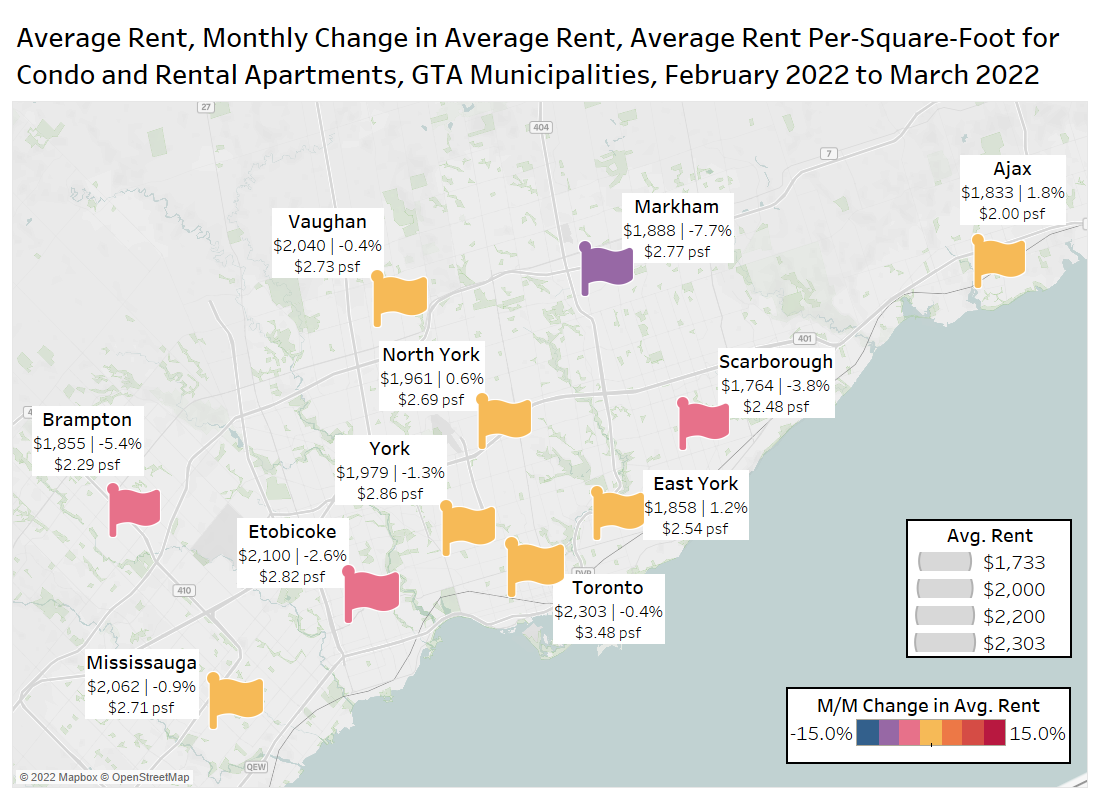
The map below presents the average rent, monthly change in average rent, and the average rent per-square-foot for municipalities in the GTA from February 2022 to March 2022.

A majority of the municipalities in the GTA experienced slight declines in their average monthly rental rates. Toronto experienced a month-over-month decline of 0.4%, Mississauga experienced a monthly decline of 0.9%, and Scarborough experienced a monthly decline of 3.8%. Richmond Hill was removed from the map due to a big shift in the composition of listings month over month.
Listing Locations of Condos, Rental Apartments, and Single Family Homes in the GTA
The map below presents the locations of Torontorentals.com listings for condominium and rental apartments in the GTA in the first quarter of 2022.
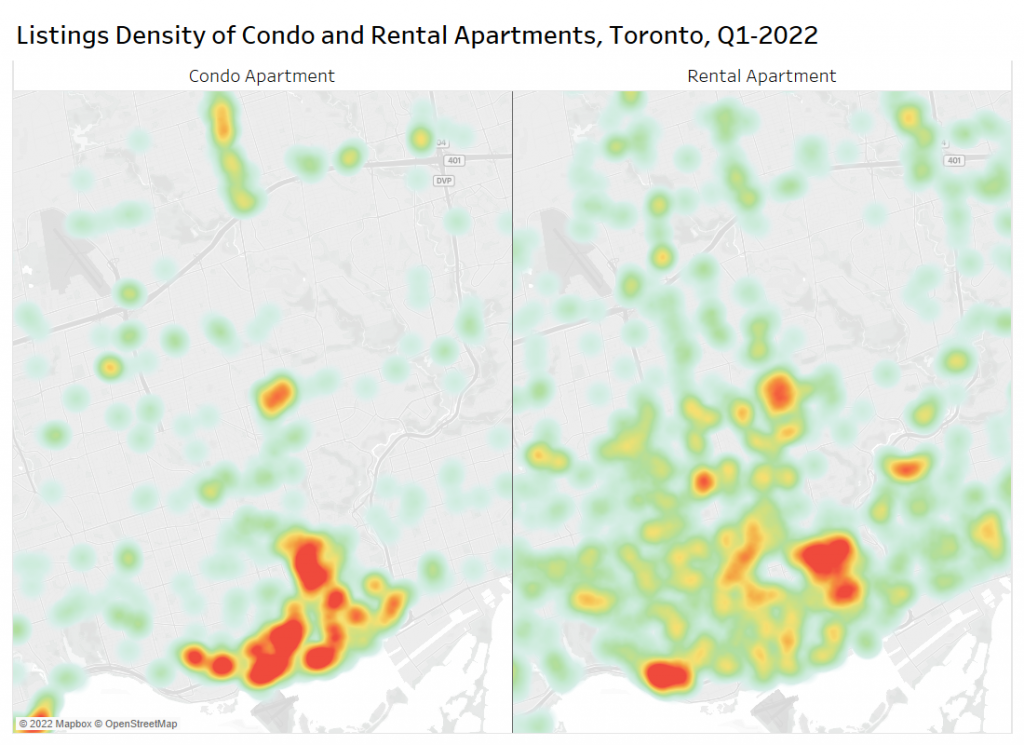
Condo apartments are strongly concentrated by the waterfront, the downtown core, and downtown west areas of Toronto, with other areas of high density moving north on Yonge Street to Eglinton.
Rental apartments are more dispersed, with areas of high density slightly to the east of the downtown core in the St. Jamestown area as well as to the west in the Parkdale area.
Scarborough Projects
The chart below looks at the most active new condo projects in Scarborough, showing the average rent per-square-foot in 2019, 2020 and 2021, as well as the first three months of 2022.
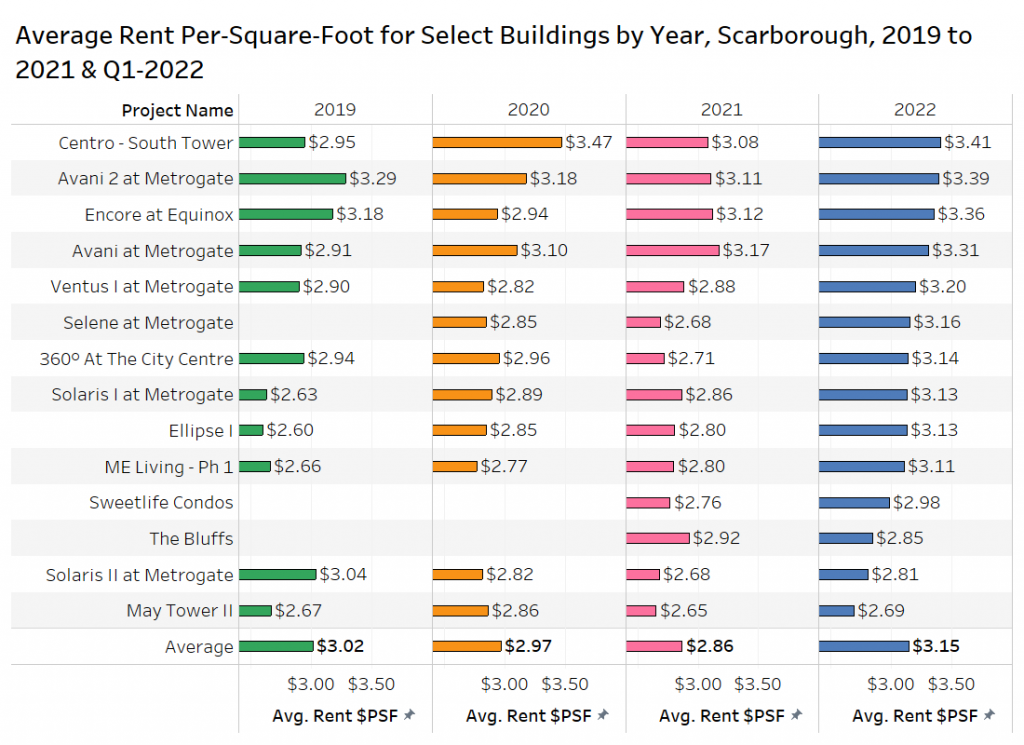
The aggregated data shows rents per-square-foot this year have surpassed pre-pandemic levels at $3.15, 4.3% higher than 2019, and up 10% over 2021.
The most expensive projects in Scarborough are Centro – South Tower at $3.41 per-square-foot and Avani 2 at Metrogate at $3.39 per-square-foot, which are at 190 Borough Drive and 275 Village Green Square.
Conclusion
After strong rent growth in the second half of last year, average rents in the GTA have started to flatten out, with most of the major municipalities in the GTA experiencing monthly declines. The monthly declines are across the board by geography, property type and bedroom count.
With interest rates rising and house prices trending downward, some prospective buyers are likely to stay in the rental market this year instead of buying. The colder weather in March could have dissuaded some tire-kickers from looking at property, as could the sixth wave of COVID which silently impacted many GTA residents.
The spring market should increase tenant demand, and with condo premiums rising to 15% to 35% in the major municipalities, it is clear that the high end of the rental market is strong again and that could pull up rents in the near future.
Moving forward, it is unclear what to expect from this time of uncertainty. New housing completions are expected to rise in the GTA in 2022 adding more supply. Persisting inflation will drive up the costs for landlords, which they will try to pass on to tenants via higher rents. Bullpen Research & Consulting expects rental rates to continue to increase, albeit not at the same rates experienced in the second half of last year.