Greater Toronto Area Rent Levels
The following figure presents data on the average and median monthly asking rents for GTA rental listings (all property types: basement apartments, rental apartments, condo apartments, townhouses and single-family homes) from January 2019 to May 2021.
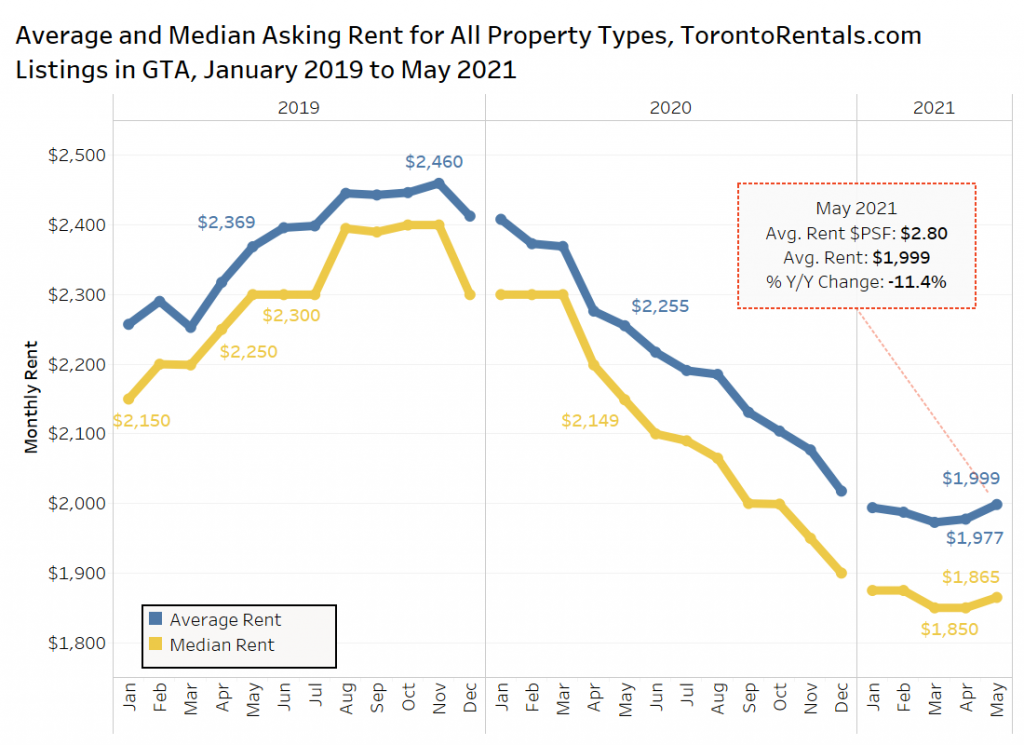
The average rent for all property types was just under $2,000 per month in May 2021. After experiencing sharp declines throughout 2020, the average rental rate in the GTA appears to have bottomed in the first quarter of this year, and has increased from $1,977 in April 2021 up to $1,999 in May 2021.
Not shown in the chart is the rent per square foot. For most of 2020, the average rent per square foot steadily declined, ending the year at $2.76 in December 2020. In May 2021, the average rent per square foot was $2.80, which represents an annual decrease of 6.7%, but a slight increase month over month. After a tumultuous 2020, the average rent per square foot has increased 2.2% since January 2021 as tenant demand has increased.
Average Rental Rates by Property Type in the GTA
The following figure presents GTA data on the average rent for single-family homes, condominium apartments, townhouses and rental apartments in April and May of 2020 and 2021 via TorontoRentals.com listings data.
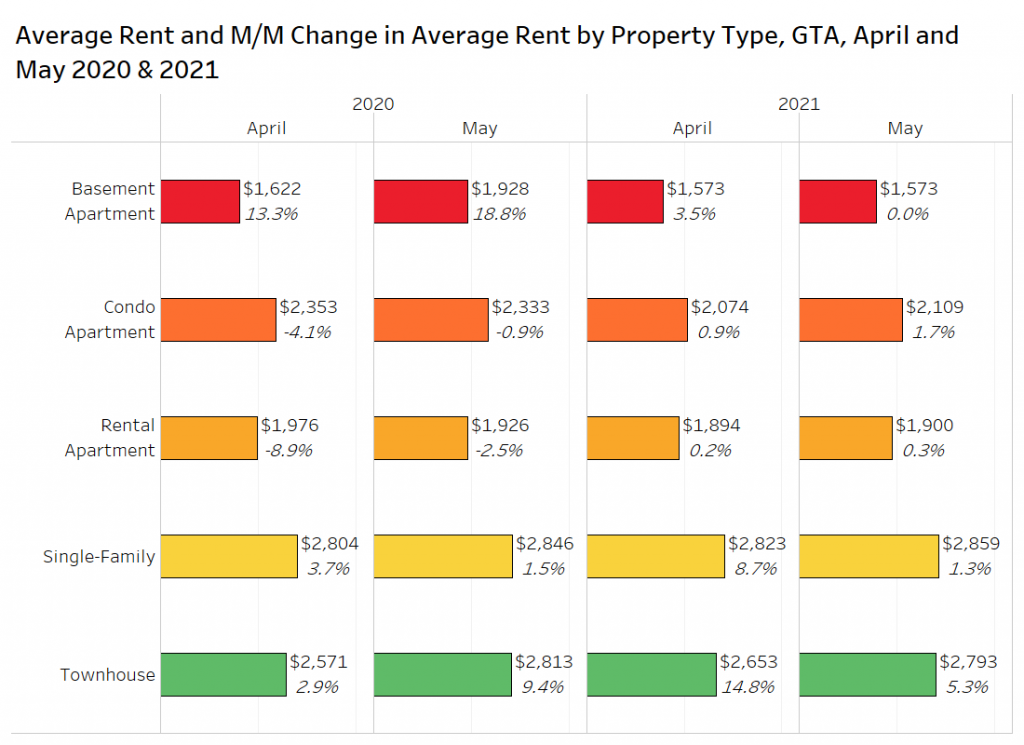
The average rent for a basement apartment in May 2021 was $1,573 per month, which remained virtually unchanged from April 2021.
Condo apartments saw their average monthly rent increase 1.7% month over month, moving from $2,074 in April 2021 to $2,109 in May 2021. Despite the modest increase, the average rent for condo apartments has declined annually by 10%.
Rental apartments have stayed relatively steady in April and May 2021, increasing by 0.2% and 0.3% month over month, respectively. In May 2021, the average monthly rental rate for a rental apartment was $1,900, which represents an annual decline of 1.3%.
In May 2021, the average rental rate for a single-family home was $2,859 per month, which represented a month-over-month increase of 1.3%. Single-family homes also experienced a month-over-month increase of 8.7% in April 2021. Rental rates are higher in 2021 than 2020, as there is increased demand for larger units in the work-from-home and educate-from-home era.
Townhouses experienced a month-over-month increase of 5.3%, moving from $2,653 per month in April 2021 to $2,793 in May 2021. In April 2021, townhouses also experienced a monthly increase of 14.8%. These increases have brought the average monthly rental rate of townhouses back to the levels of May 2020. Similar to basement apartments, the townhouse segment is typically a smaller sample, making it more sensitive to differences in individual listings.
Average Rent by Bedroom Type
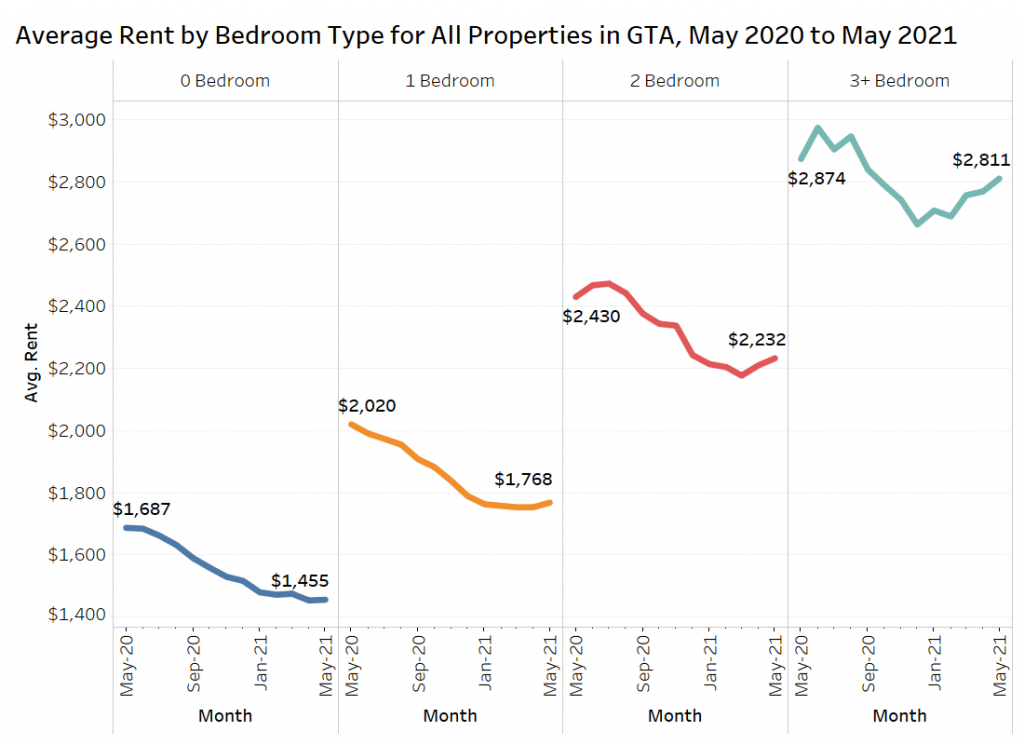
The figure below presents data on the average rent by bedroom type in the GTA from May 2020 to May 2021 for all property types.
The average monthly rental rates for all bedroom types follow a similar pattern, experiencing declines throughout the year before staying steady or gradually increasing at the start of 2021. In particular, we can see that average monthly rental rates for three-bedroom-plus units have increased since January 2021, suggesting that the demand for larger suites is increasing as a larger share of employees continue to work from home.
Studio suites have decreased 14% annually down to $1,455 per month, one-bedroom suites have decreased 13% annually down to $1,768 per month, two-bedroom suites have decreased 8% annually to $2,232 per month, while three-bedroom-plus suites have decreased annually by 2% to $2,811 per month.
However, all bedroom types have increased month over month, by 0.2%, 0.8%, 1.0% and 1.5%, for three-bedroom-plus types respectively.
Furnished Versus Unfurnished Rentals
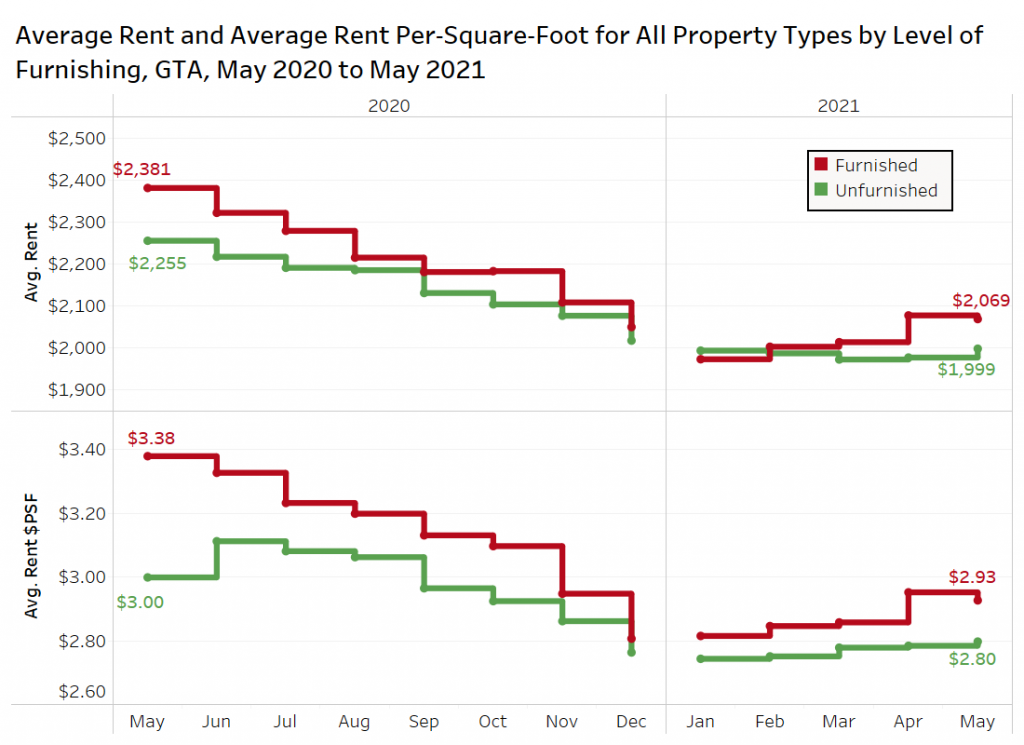
TorontoRentals.com started to separate furnished versus unfurnished units in April 2020. The figure below presents data on the average rent and average rent per square foot for condo and rental apartments by the furnished level over the last 13 months in the GTA.
The average monthly rent for a furnished unit was 3.5% higher than the average monthly rent for an unfurnished unit in May 2021, while the average rent per square foot for a furnished unit was 4.6% higher than the average rent per-square-foot for an unfurnished unit.
In May 2020, the average rent for a furnished unit was 5.6% higher than that of an unfurnished unit — the furnished premium has decreased compared to a year ago. The average rent per square foot in May 2020 for a furnished unit was 12.7% higher than the average rent per square foot for an unfurnished unit, keeping in mind that the furnished units are smaller by about 50 square feet, or 6% smaller.
Average Rent in Toronto and the Rest of the GTA
The following figure shows the average rent and the average rent per square foot for condo apartments, rental apartments, and single-family homes in Toronto (former City, pre-amalgamation) and in the rest of the GTA from the start of 2020 to May 2021.
The small sample size of single-family homes in Toronto and the rest of the GTA has a large effect on the data, leading to the monthly volatility. However, rents have increased recently, despite the flatness of rent per square foot, as the homes leasing are larger on average over the past couple of months.
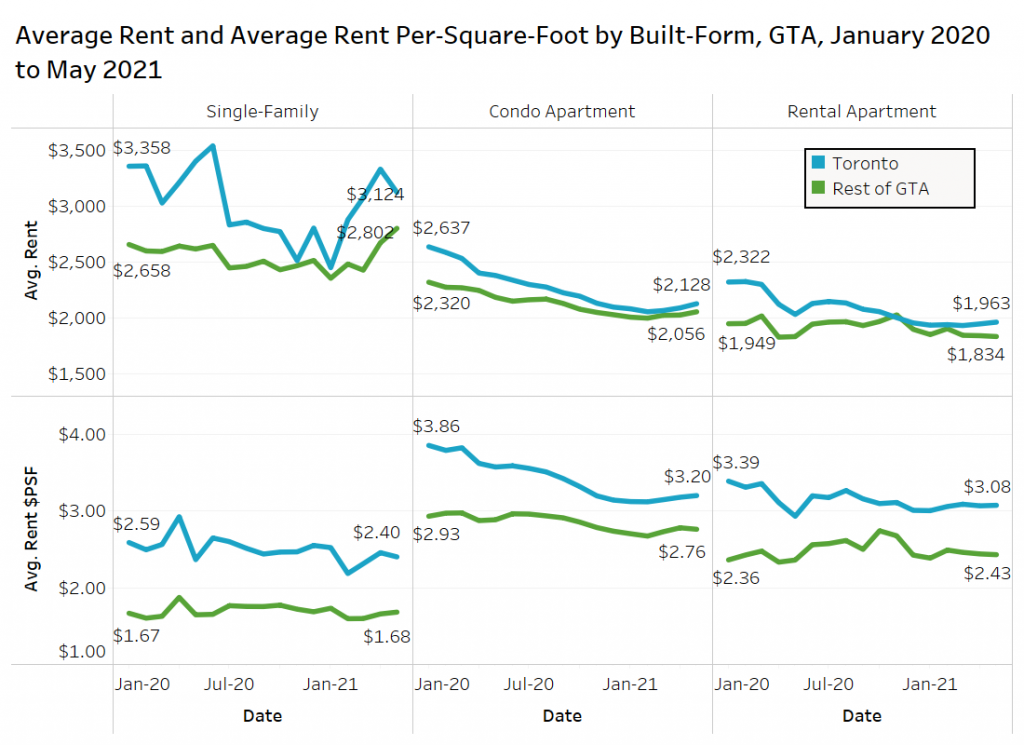
We can see that the gap between the average rent for a condo apartment in Toronto and the rest of the GTA steadily decreased during 2020. The difference in average rent between rental apartments in Toronto and the rest of the GTA has also decreased. Lastly, the gap between condo rents and traditional apartment rents has also narrowed. Keep in mind that rental apartment landlords are more likely to offer incentives than a condo investor.
The average rent for condo apartments in Toronto is down 11% annually to $2,128 per month, but up 2% month over month. Rental apartments have seen rents drop by 3% from a year ago, but have increased by 1% month over month.
Average Rents by Municipality
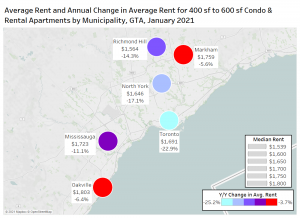
Average rent for condominium and rental apartments in GTA municipalities in May 2021 is presented below. Toronto is broken up into its former municipalities, prior to amalgamation.
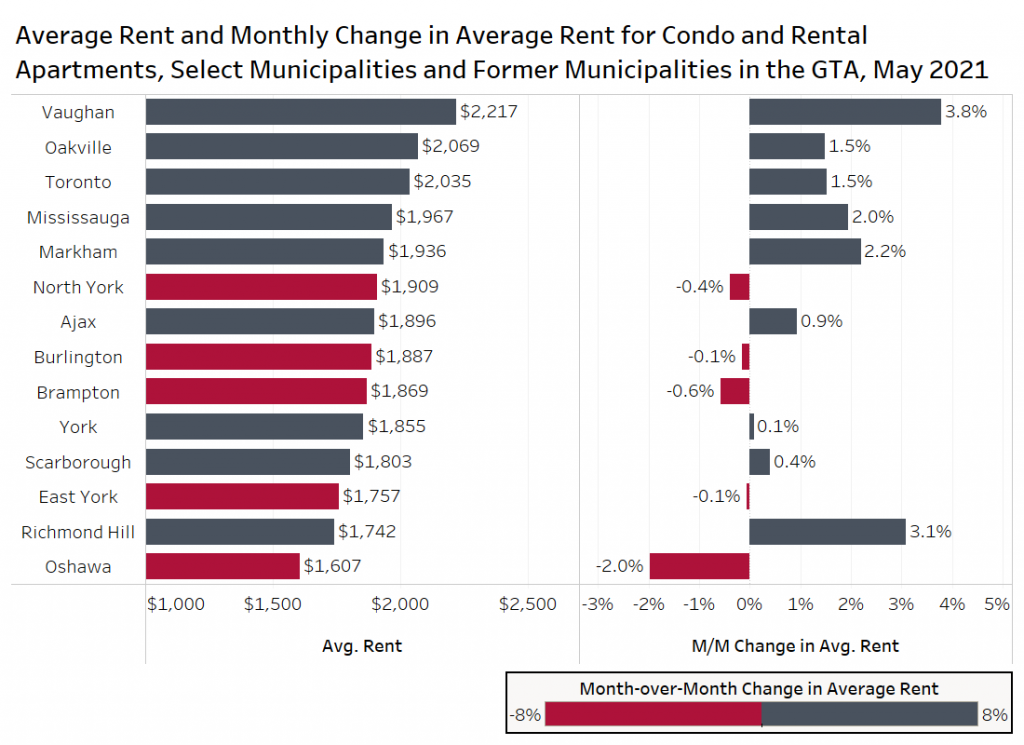
The average rent for a condo or rental apartment in Vaughan experienced the largest month-over-month increase at 3.8%, rising to $2,217 per month in May 2021. The monthly rental rates in Richmond Hill also increased at a similar pace, experiencing a month-over-month increase of 3.1% to $1,742 per month. The sample size of listings in these municipalities is not large, and as a result, their average rental rates can fluctuate monthly (there are few large rental apartments in Richmond Hill and Vaughan).
Toronto, which has a robust sample of listings, grew by 1.5% month over month, suggesting that the demand for suites in downtown Toronto is continuing to increase.
Average Rent in Select Areas in GTA by Number of Bedrooms
The following figure presents the average monthly rental rate for condo and rental apartments in select municipalities and former municipalities in the GTA, organized by the number of bedrooms. Blue highlights the highest average monthly rent within a bedroom segment, while orange highlights the lowest average monthly rent within a bedroom segment. Data is included if there are five or more listings in the category.
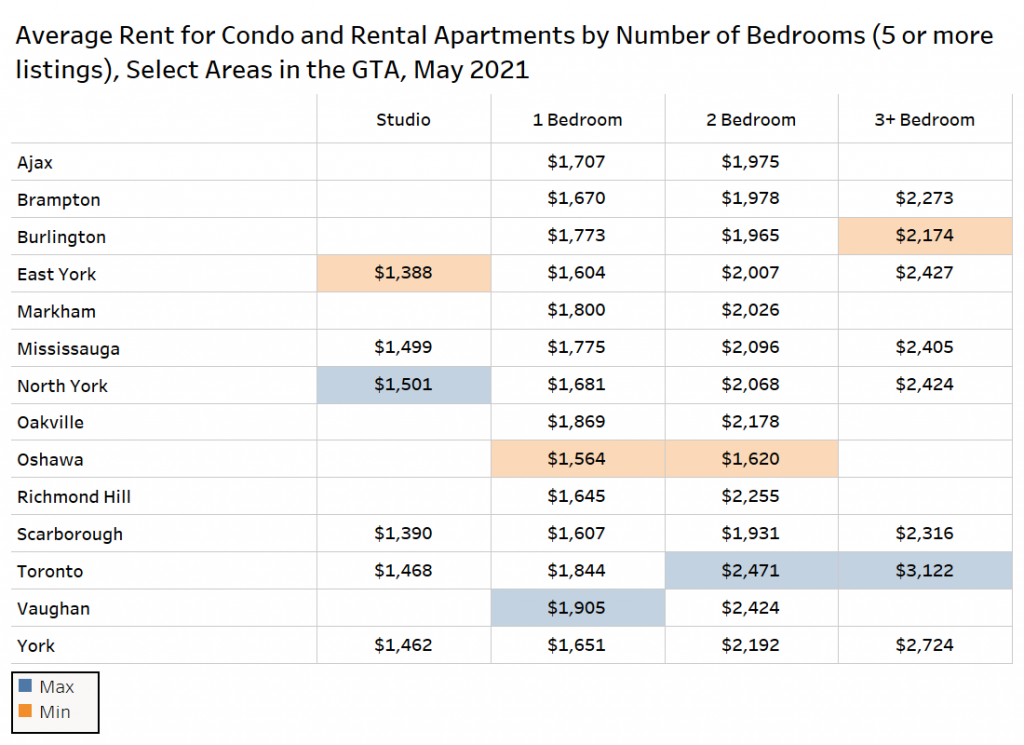
North York had the highest average monthly rental rate for studio suites at $1,501 per month, while East York had the lowest at $1,388 per month.
Vaughan had the highest average monthly rental rate for a one-bedroom suite at $1,905 per month, while Oshawa had the lowest at $1,564 per month.
The highest average monthly rental rate for a two-bedroom suite was found in Toronto at $2,471 per month, while the lowest was in Oshawa at $1,620 per month.
Toronto sported the highest average monthly rental rate for larger suites (three-plus bedrooms) at $3,122 per month, while Burlington had the lowest monthly rental rate for larger suites at $2,174 per month.
Average Rent Per Square Foot for Select Areas in the GTA by Rounded-Unit Size
The following table presents the average rent per square foot for condo and rental apartments in select areas in the GTA, organized by rounded-unit size. Blue highlights the highest average monthly rental rate for that rounded-unit size segment, while orange highlights the lowest average monthly rental rate.
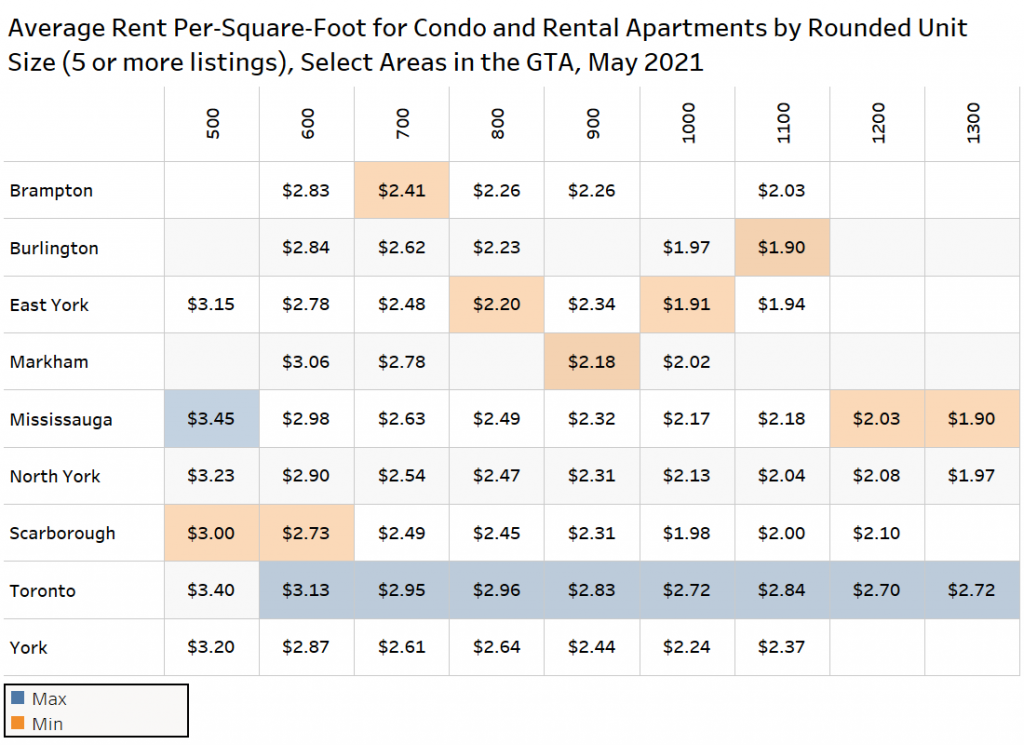
Toronto consistently has the highest average rent per-square-foot across the majority of unit sizes, topped only by Mississauga for 500-square-foot units.
Scarborough has the least expensive small suites, while Mississauga has the cheapest large units.
Rents Per Square Foot for Condo and Rental Apartments by Rounded-Unit Size
The following figure shows the per-square-foot rents for condo and rental apartments for units with a rounded size between 300 square feet and 2,000 square feet. Blue marks represent condo apartments, red marks represent rental apartments, and the black lines show the average rent per square foot for the corresponding rounded-unit size (rounded to the nearest hundred).
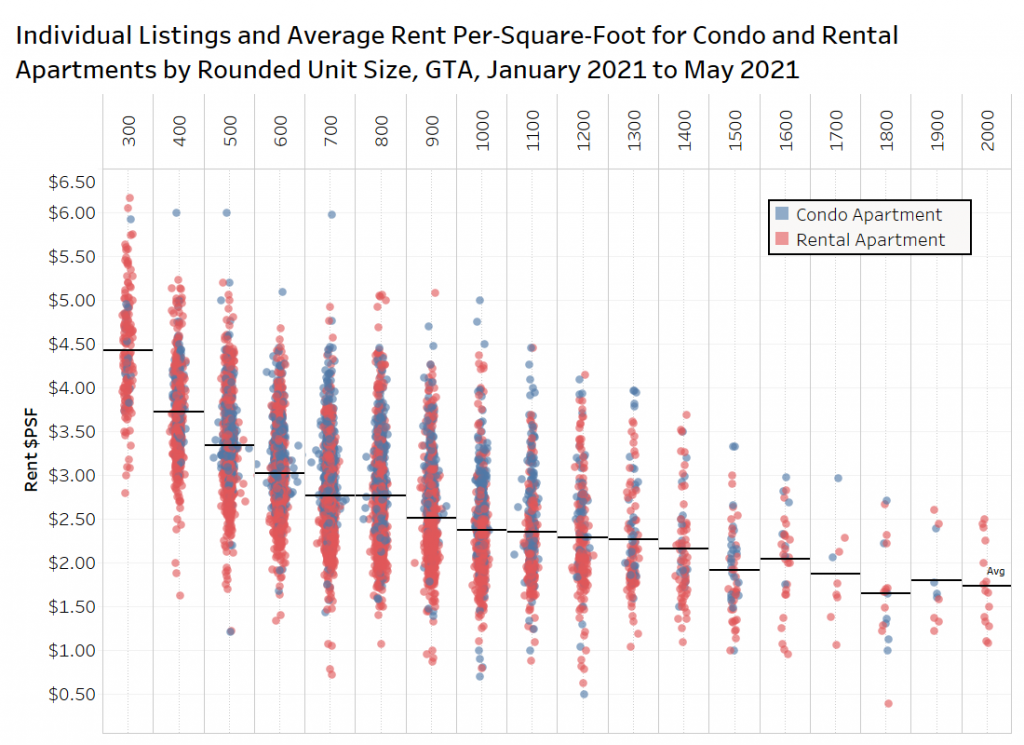
The average rent per square foot is the highest for units with a rounded size of 300 square feet, and begins to decline as the unit size increases. The average rent per square foot declines at a lesser rate as the rounded-unit size increases beyond 1,000 square feet. This shows decreasing marginal utility, as tenants value each additional square foot they lease as less than the previous one.
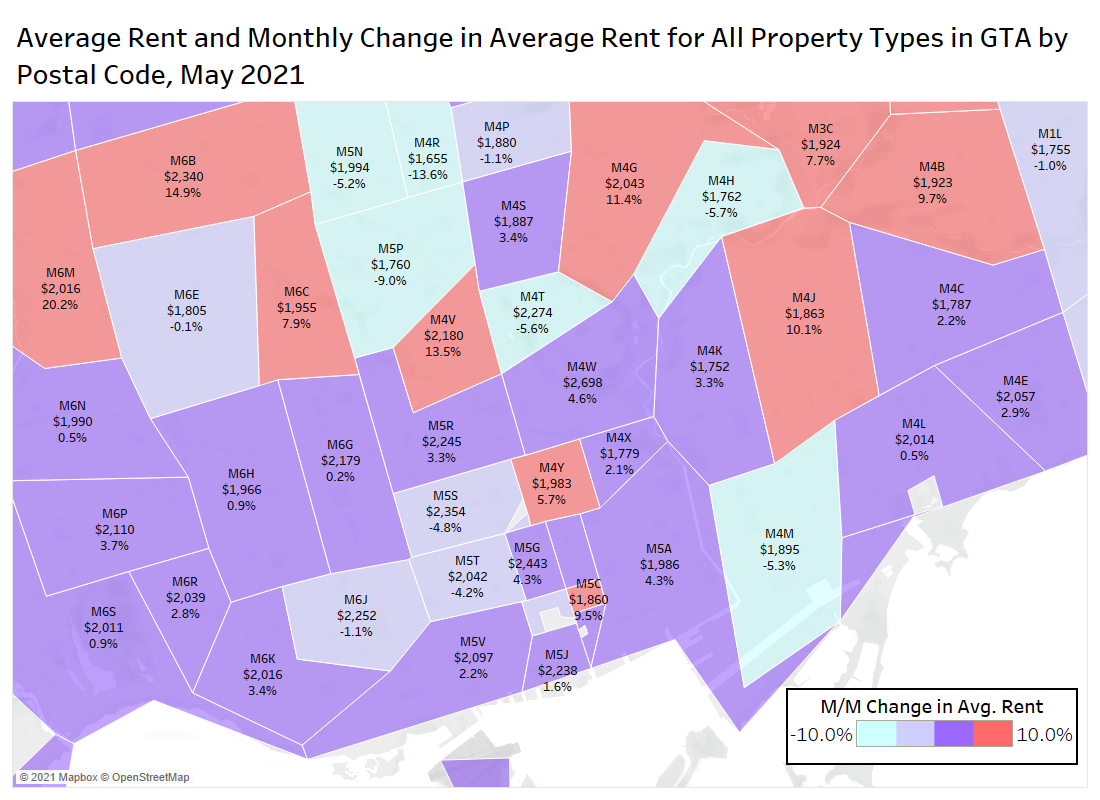
Average Rent by Postal Code
Areas Outside the Core are Recovering Faster than Downtown
While the average rents for properties in the GTA generally declined during the pandemic, the market has reversed course and started to rise again.

A map of the postal codes in the GTA shows the majority of the postal codes are red or dark purple — indicating these postal codes have experienced a positive change in average rent month over month. There is more red outside the downtown core, suggesting those areas are recovering faster than downtown.
The postal codes that have experienced the largest monthly increases include M6B at 14.9%, M4V at 13.5%, M4G at 11.4%, M4J at 10.1%, M4B at 9.7%, and M6C at 7.9%. Keep in mind that some of the areas do not have robust sample sizes.
The postal codes that experienced the largest monthly decline in average rental rates include M4R at 13.6%, and M5P at 9%.
Rent Per Square Foot for Condos Built Over the Past Decade
The chart below presents data on the average rent per square foot for condominium apartments in the former City of Toronto from January 2011 to May 2021. The data is broken out for the year of completion and the separate months this year.
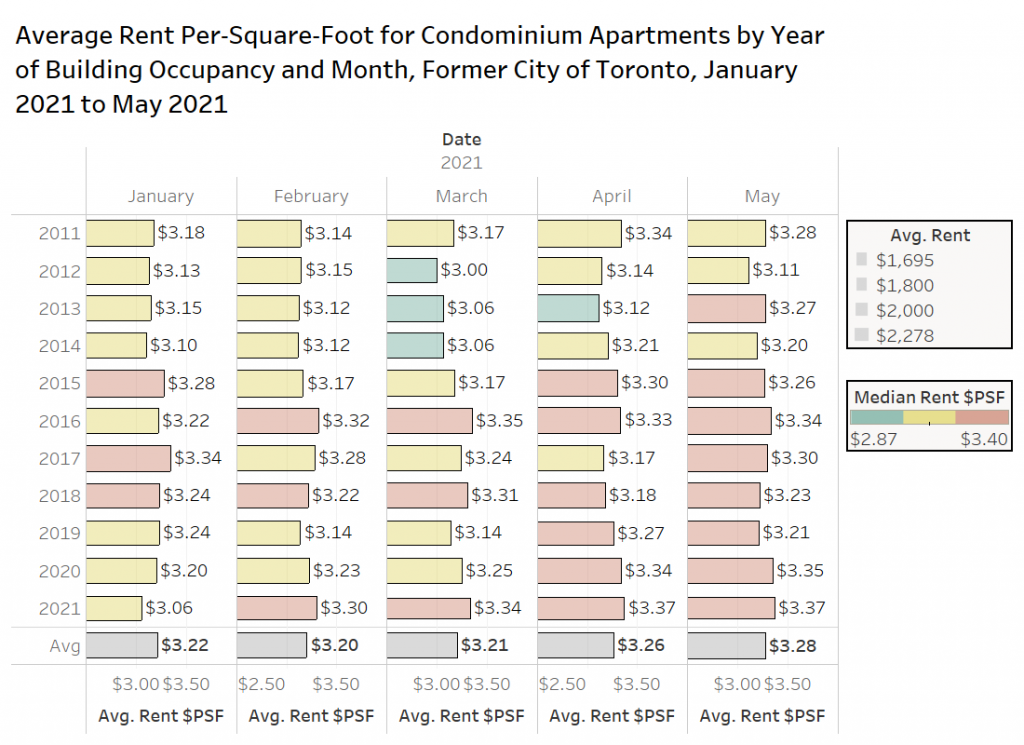
Overall, rents have increased month over month in March, April and May, with units completed over the past five years commanding slightly higher rents.
The newest buildings completed are offered at about $3.35 per square foot.
Conclusion
The pandemic and rolling lockdowns have undoubtedly had a major impact on the GTA rental market as it has in other major cities in Canada and the United States, with average monthly rents declining throughout the year. The rapid pace of decline has slowed considerably, and in some cases, several rental metrics have begun to slowly reverse trend and increase.
The average monthly rental rates for studio suites, one-bedroom suites, two-bedroom suites, and three-plus-bedroom suites have all either stayed relatively constant or increased since the start of 2021. The average monthly rental rates have also either stayed the same or increased across all property types, suggesting that rental rates will continue to increase moving forward.
The continued increase in demand for larger sized suites reflects the continuing popularity of working from home, as the demand for more space grows. But the demand for smaller suites downtown could begin to increase in the coming months, as downtown Toronto experienced a 1.5% increase in average monthly rent.
Several American cities including New York, San Francisco and Chicago are reporting strong lease-up activity over the past two months, and with the Canadian vaccine rollout improving, the Toronto market might be only two to three months behind, with a big pick-up in leasing activity expected in the fall. Bullpen is forecasting rent growth of 12% to 14% next year when the borders open, tourism ramps up, students return to campus, and many office towers are back to full capacity.
Bullpen Research & Consulting Inc. works with data from TorontoRentals.com, a rental listings website and has access to 10,000 to 20,000 listings per month. The analysis is based on those listings unless otherwise noted.