Greater Toronto Area Rental Market
The Average Rent for All Property Types in the GTA has Declined by 16% Annually in November 2020
The top panel in the chart below presents TorontoRentals.com data on the average monthly asking rent for GTA rental listings (all property types: basement apartments, rental apartments, condo apartments, townhouses and single-family homes) from November 2019 to November 2020.
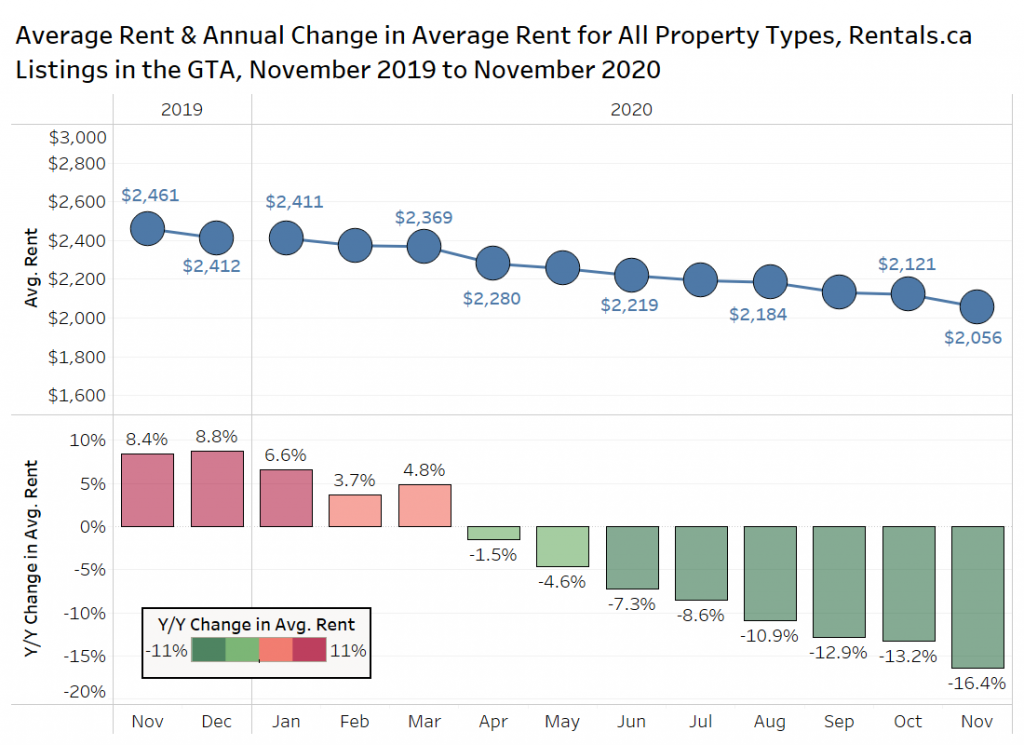
The average rent for all property types was just under $2,060 per month in November 2020, the 12th consecutive monthly decline. The average rent is down 3.1% monthly, and 16.4% annually (as shown in the bottom panel). Prior to the pandemic, rents were increasing by 4% to 6% year-over-year in early 2020, and 9% annually in late 2019.
Average Rental Rates by Bedroom Type
The data presented in the chart below on the average rent in the GTA from November 2019 to November 2020 shows how quickly rents have declined by bedroom type. Five- and six- bedroom units have been removed from the chart, as the small sample sizes lead to monthly volatility.
Average Asking Rents for One- and Two-Bedroom Units Both Down 15% annually
In November of 2019, rental rates in the GTA were strong, with studio units showing close to 16% rent growth annually, and one-bedroom units posting growth of over 14%. Fast forward to November 2020, where COVID-19 continues to negatively impact the market, studio to three-bedroom suites are all experiencing their greatest monthly declines since the pandemic started.
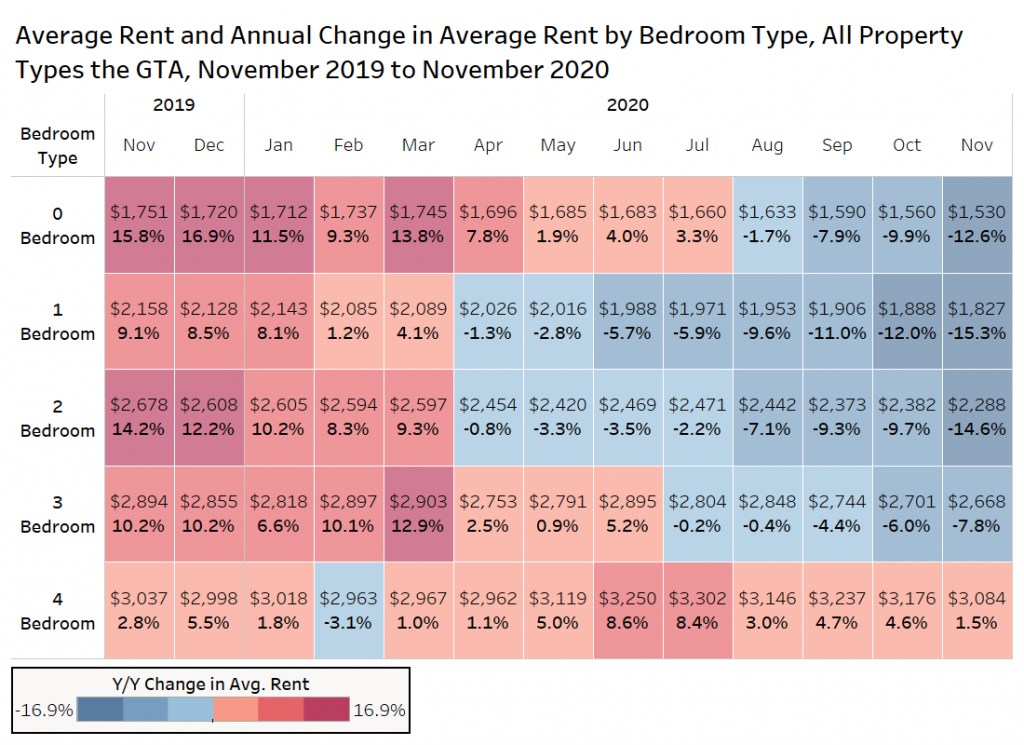
One- and two-bedroom suites are both down by about 15% annually. Average rents are now $1,827 for a one-bedroom, and $2,288 for a two-bedroom, which equals a potential saving for the prospective tenants of $330 and $390, respectively from one year prior.
Studio units experienced a slightly smaller annual decrease at 12.6%, with an average monthly rent of $1,530, while three-bedroom suites dropped 7.6% year over year, resulting in an average monthly rent of $2,688.
Four-bedroom units, which are primarily suburban single-family or townhouses, were the only category to experience rent growth, and showed a nominal, albeit positive, year-over-year increase of 1.5%. The sample size is not large in comparison to the other bedroom types, and the results are volatile on a monthly basis as the composition of the sample changes rapidly (based on location, lot size and unit size).
Average Rental Rates by Property Type
The next figure visualizes GTA data on the average rent for single-family homes, condominium apartments, townhouses and rental apartments in November of 2019 versus November of 2020 via TorontoRentals.com listings data.
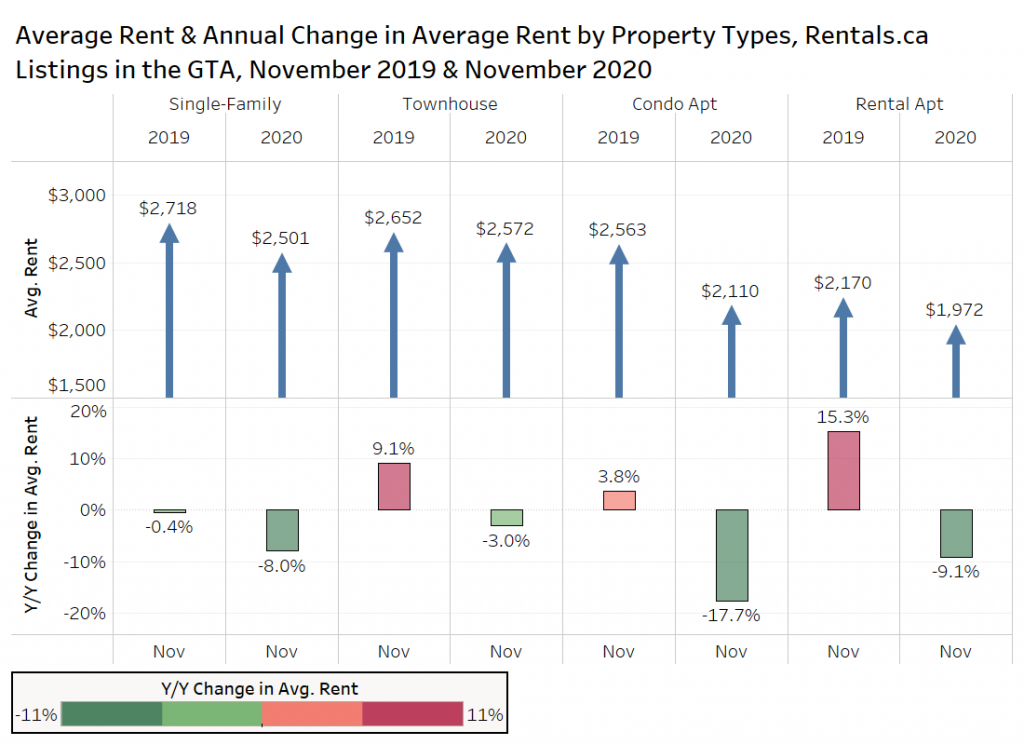
In November of 2019, the average rent for single-family properties in the GTA was about $2,720 per month, a decrease of 0.4% annually. As of November 2020, average rent has declined by a further 8.0% year over year to just over $2,500 per month.
Interestingly, townhouses had the highest average rent at $2,572 per month in November 2020, $71 higher than single-family properties. Townhouses experienced a 3% year-over-year decrease in average rent, which was the smallest decrease across all property types.
The average rent for condo apartments was up by 3.8% in November 2019 at just over $2,560 per month on average. In 2020, the market experienced a truly significant and unprecedented annual decline in average rent of 17.7%. The average rent has dropped by $450 per month to $2,110 on average. Condo apartments have steadily declined from August of 2019 to November 2020.
Rental apartment average rents dropped to $1,972 in November 2020, about $200 lower than the November 2019 level. The rental apartment category also represents the greatest change from the year prior, where annual rent growth exceeded 15%, falling all the way to a 9.1% annual decrease in November 2020.
Many owners and landlords are offering one or two months of free rent, as opposed to dropping their asking rent. This is more common for the most expensive properties on the market, including several purpose-built rental apartments completed over the past three years.
One of the newest purpose-built rental apartments in the Yonge and Eglinton area at 18 Erskine Avenue is offering two months free rent and a $1,500 move-in bonus on one-bedroom suites.
Average Rents by Municipality
Average Annual Rent Down 19% in Toronto, Oshawa Up By 14%
The chart below looks at data on the average rent for condominium and rental apartments in GTA municipalities in November 2020 (Toronto is broken up into its former municipalities, prior to amalgamation).
Of the 13 municipalities presented, 12 experienced declines in average rent, nine of which dropped more than 10%. Average rent in pre-amalgamation Toronto continues to experience dramatic rate decreases, with November year-over-year changes in average rent approaching 19%.
At the other end of the spectrum is Oshawa, which has seen a 13.8% increase, but the area has the most affordable average rent at $1,694. The addition of a number of new rental listings at 100 Bond and Central on Emma contributed to the increase in the municipality. When looking only at projects that had listings in both 2019 and 2020, this more apples-to-apples approach shows that the average rent increased by about 10% in 2020 over 2019.
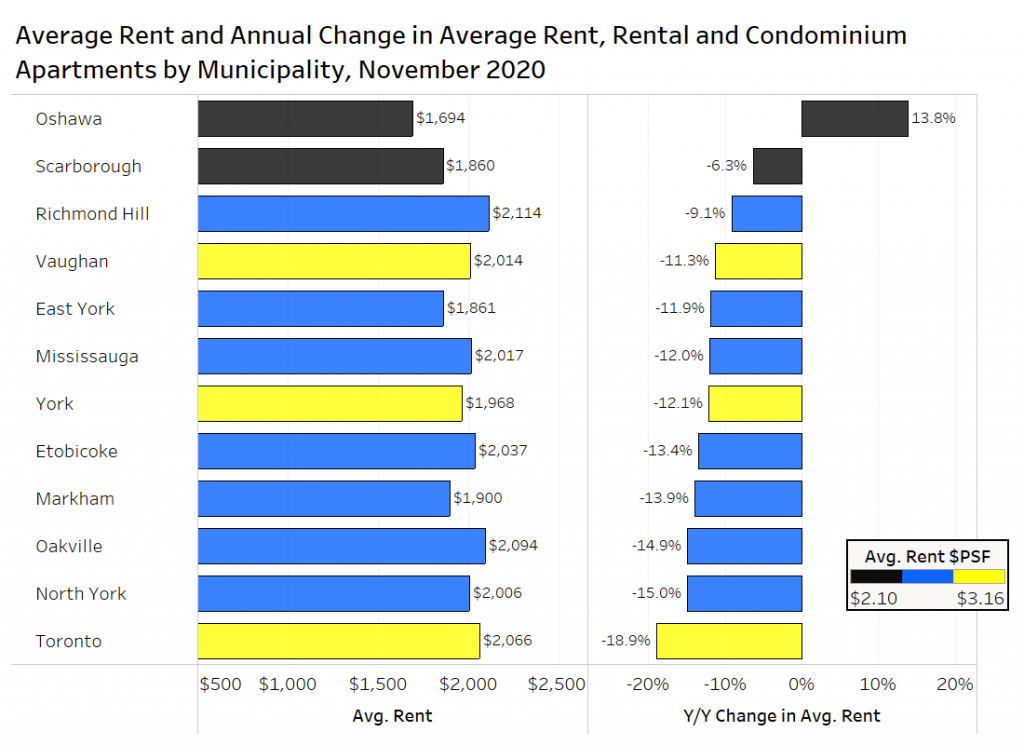
The suburbs are also seeing notable rent drops, with the “905” municipalities of Richmond Hill, Vaughan, Mississauga, Markham and Oakville all experiencing double-digit decreases ranging from 9.1% in Richmond Hill to 14.9% in Oakville.
Average Rental Rates by Rounded Unit Size in Toronto
The average rent and average rent per square foot for condominium and rental apartments by rounded unit size is summarized in the chart below. Suites from 450 square feet to 1,049 square feet are rounded to the nearest hundred to examine the asking rents in November 2018, November 2019 and November 2020.
In the former City of Toronto (pre-amalgamation), average rent and average rent per square foot for every unit size in both condo and rental forms experienced year-over-year declines in November 2020. Changes in the marketplace are so dramatic that in November 2020, a tenant could lease an 800-square-foot condo for approximately the same amount that an average 600-square-foot condo leased for in 2019.
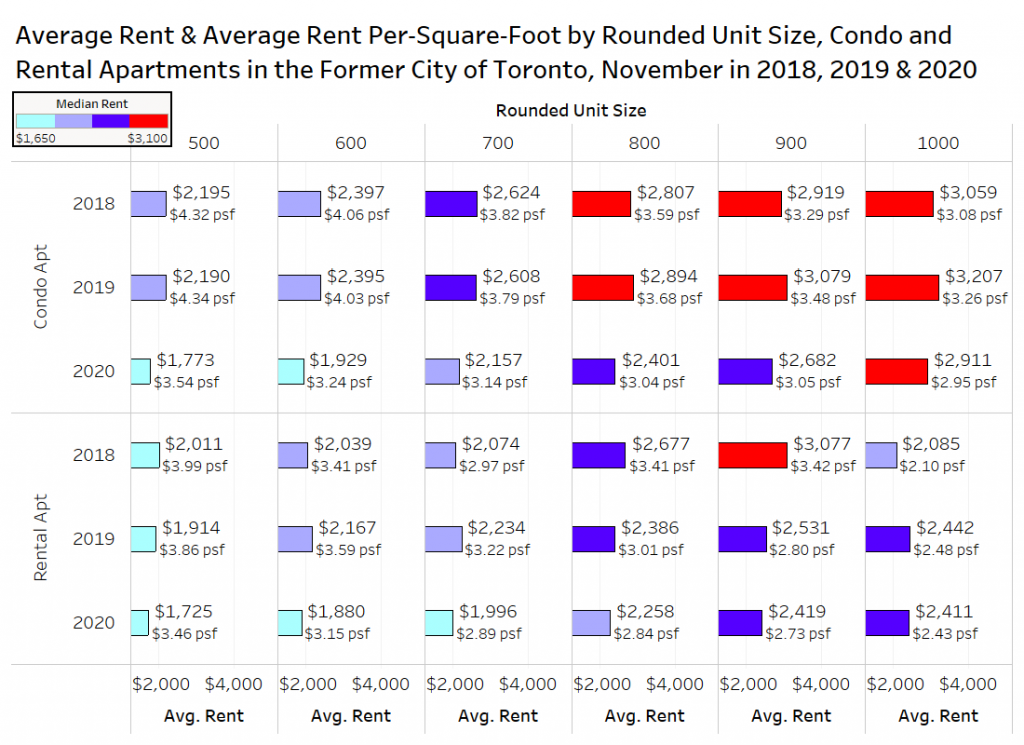
The average rent for a 500-square-foot condo cost a tenant a premium of about $200 to $300 in 2018 and 2019, but that gap was much closer in November 2020, with the average rent showing a difference of less than $50 between both property types, $1,773 for condo apartments and $1,725 for rental apartments.
Condo and rental apartments rounded to 500 square feet had the highest rent per square foot at $3.54 and $3.46, respectively. Condo rents per foot dropped 18% annually, while rental apartment rents per foot declined by 10% annually.
The biggest decline occurred for units rounded to 600 square feet, with condo apartments down about 20% annually, and rental apartments down about 12% annually.
1,000-square-foot condos had the highest average rent at $2,911 and the lowest rent per square foot at $2.95. 1,000-square-foot rental apartments had an average rent of $2,411 per month, and a per-square-foot rent of approximately $2.45. The annual rent declines were more muted for these larger suites at about 9% for condos and 1% for rental apartments.
Condo and Rental Apartment Per-Square-Foot Rent Levels
The condo rental market in downtown Toronto is soft, with the average rent per square foot down 18.7% year over year ($3.95 per square foot to $3.21 per square foot). Rental apartment owners have seen average rents per foot drop by 5.5% annually in the core (refer to upper left hand corner of the line chart below).
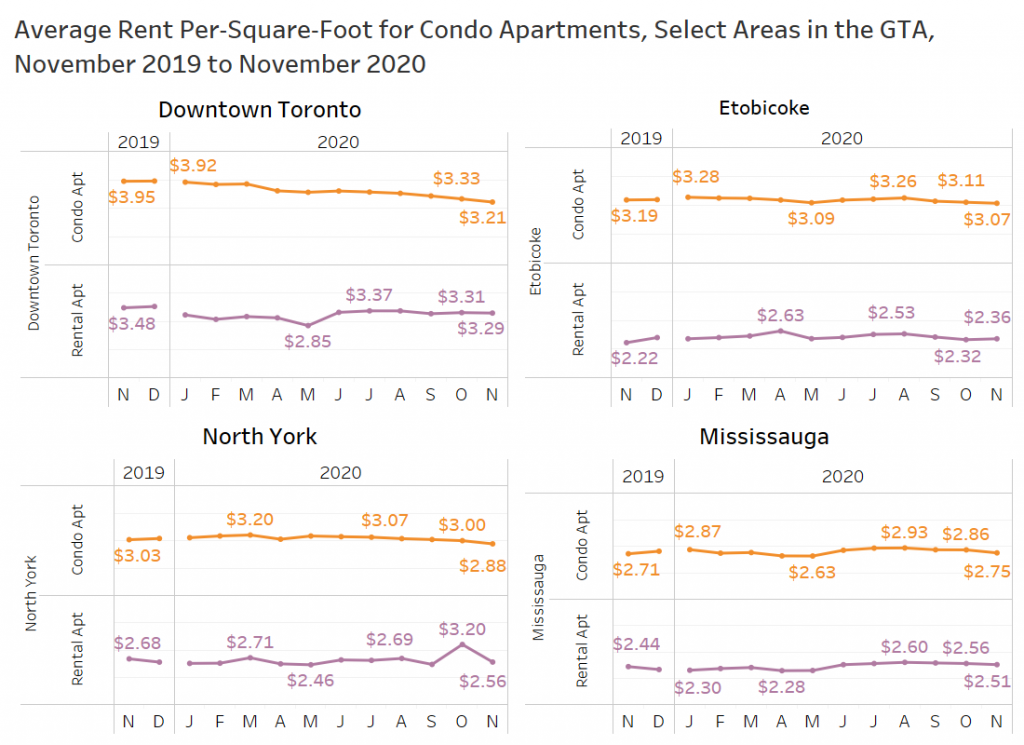
This chart also looks at the average rent per square foot for condo and rental apartments in Etobicoke, North York, and Mississauga. It should be noted that not all properties listed on TorontoRentals.com have their unit size available, so this data is based on a smaller sample size, and is a straight average, not a weighted average.
In Etobicoke, average condo rental rates per square foot are down 3.7% annually ($3.19 per square foot to $3.07 per square foot), while rental apartment rates have increased from November 2019 to November 2020 by 6.3% ($2.22 per square foot to $2.36 per square foot).
In North York, condo rents are down by about 5% annually to $2.88 per square foot, but the rental apartment rate jumped in October after TorontoRentals.com added all of the available inventory at a new purpose-built building, but only a couple of those listings were included in November, leading to the volatility month over month.
Mississauga rents have been relatively stable year over year with a slight decline in condo rents (-3.7%), and a slight increase in rental apartment rates (+2.9%).
Market Share of Listings by Bedroom Type in Downtown Toronto
The chart below looks at the market share of condo apartment listings in downtown Toronto by quarter in 2019 and 2020 (Q4-2020 is October/November only).
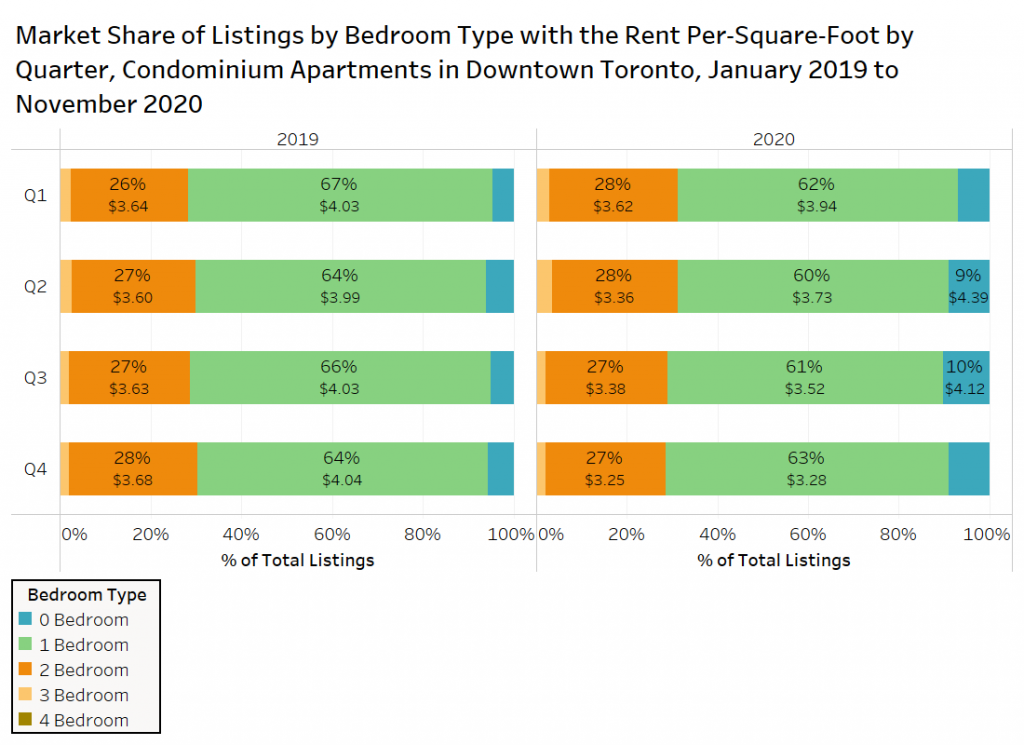
There has not been a significant difference in the share of condo rental listings on TorontoRentals.com by quarter of the last two years. The one noticeable difference is the increase in studio apartment listings. In Q3-2019, studio (0 Bedroom) suites accounted for just 5% of the total listings in downtown Toronto, that doubled in Q3-2020 to 10%. The market shares were 6% in Q4-2019, and 9% in Q4-2020.
The chart also shows the average rent per square foot by bedroom type, indicating that the average rates were relatively close year to year in the first quarters of 2019 and 2020. The huge impact that COVID has had on the market is demonstrated in the fourth quarter data, with two-bedroom units down 12% annually, one-bedroom units down 19%, and studio/bachelor suites down 18% from $4.64 per square foot to $3.82 per square foot.
Average Rental Rates for New Apartment Product
The bar graph below looks at the average rent, average unit size, and average rent per square foot for a select number of condominium and purpose-built rental apartments that were completed (or stated pre-leasing) in 2020.
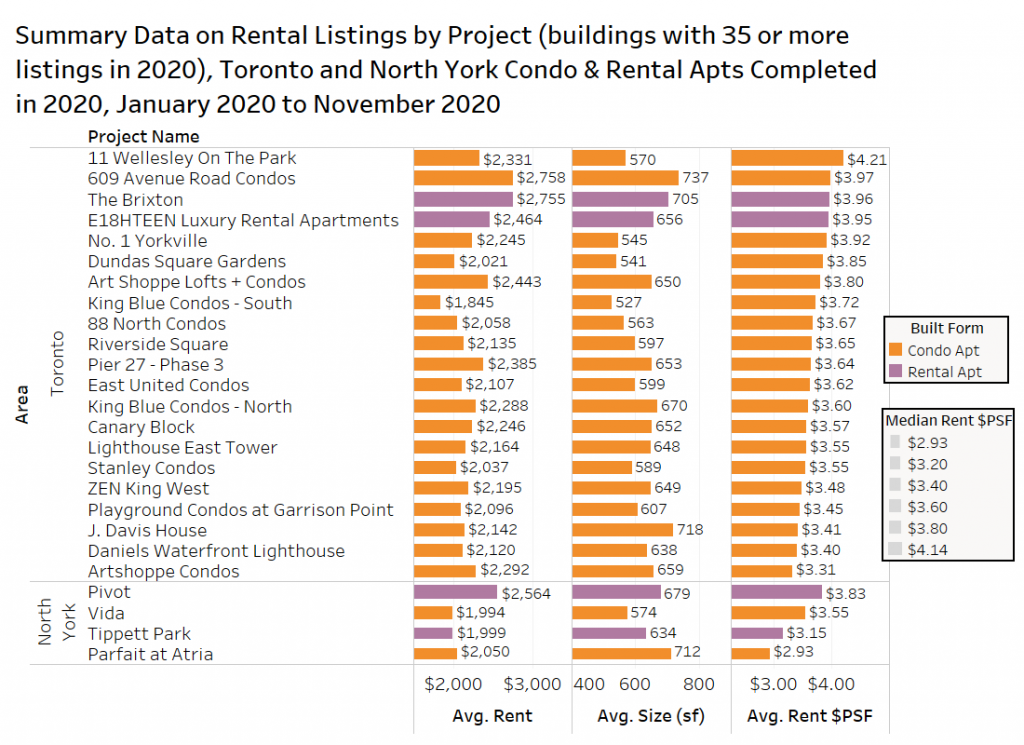
The highest rent is at 11 Wellesley on the Park, off Wellesley Street West along the Yonge Street corridor. The 60-storey tower started pre-construction sales in mid-2014, selling 675 units in less than one year at between $690 psf and $770 psf.
Investor-landlords have asked $2,330 per month on average for 570 square feet, a weighted average of $4.09 per square foot, and a straight average of $4.21 per square foot as shown in the chart.
Minto Yorkville Park also launched for sale in 2014 at a price that was about 40% more than 11 Wellesley on the Park. The 25-storey tower with just under 200 units was completed in early 2020. Investors are asking nearly $2,750 per month for the suites for about 750 square feet, for a weighted average of $3.65 per square feet. The straight average rent level as shown is $3.98 per square foot.
Furnished versus Unfurnished Rentals
The next line graph presents data on the average rent and average rent per square foot for condo and rental apartments by the furnished level over the last eight months in the former City of Toronto.
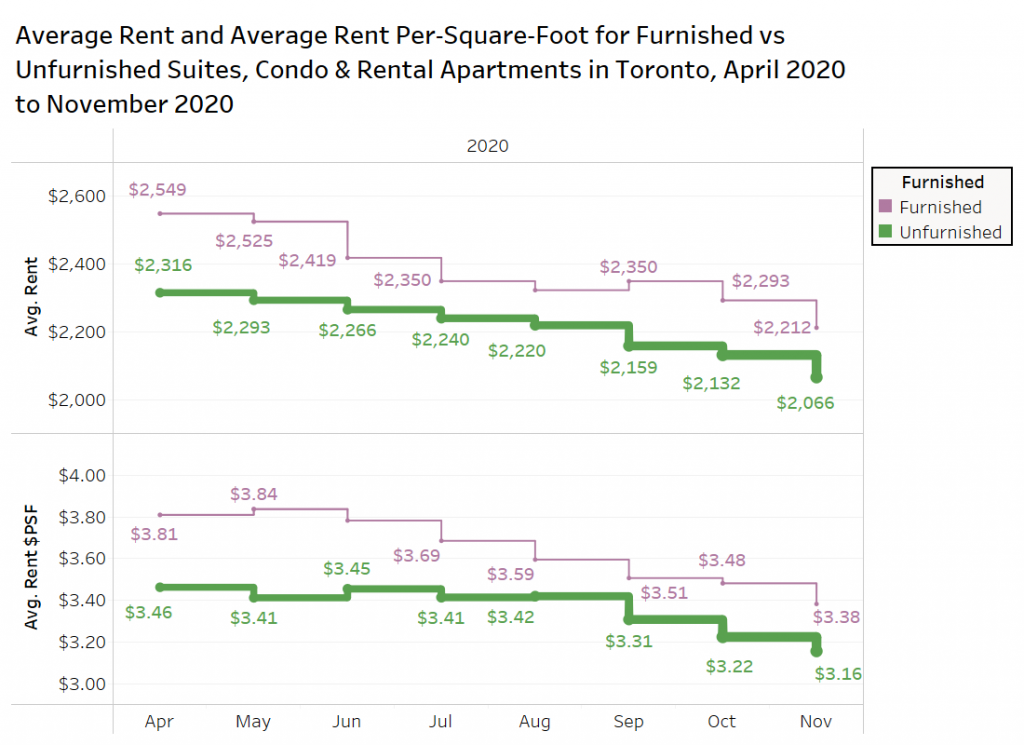
Early in the pandemic period in 2020, there was a rent premium of about 10%-12% for furnished units in Toronto, but that has declined to about 5% to 7% over the last four months.
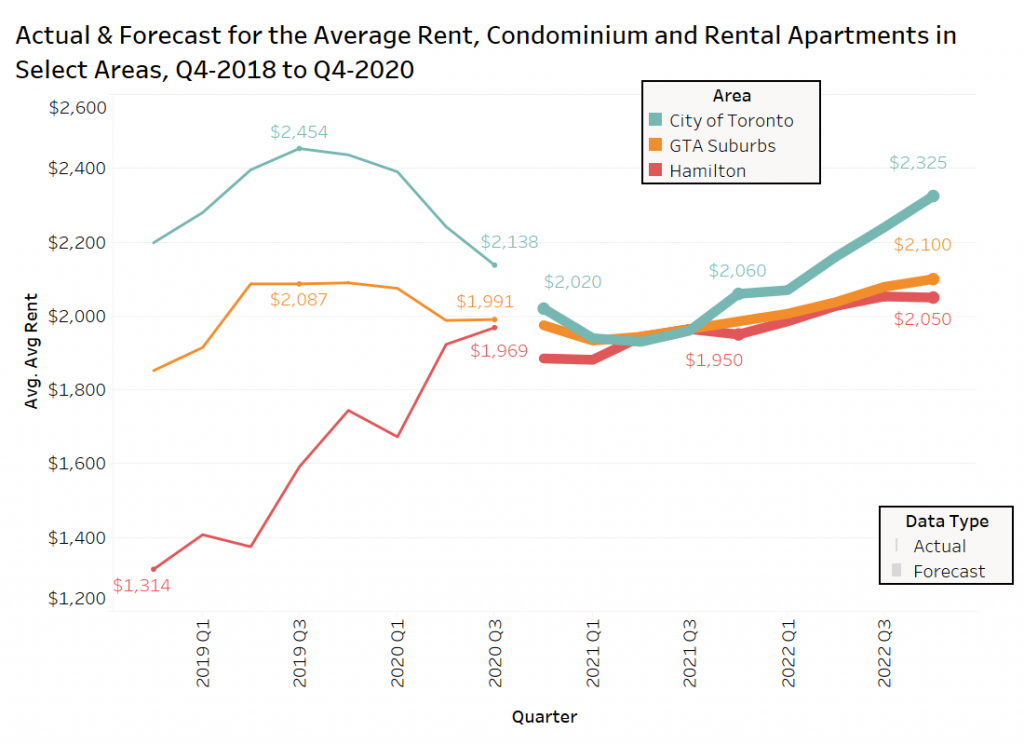
Rent Forecast
The actual average rental rates for condominium and rental apartments by quarter from Q4-2018 to Q3-2020, and the rent forecasts by Bullpen Research & Consulting from Q4-2020 to Q4-2022 are shown in the chart below for three areas: the city of Toronto, the GTA suburbs and the city of Hamilton. The last two areas were prepared for comparison purposes only.
The city of Toronto is expected to continue to see declining rents until the middle of 2021, before slowing recovering in late 2021 and rising sharply in 2022, finishing that year up 13% to 14% annually, but still slightly below the 2019 peak rent level of $2,454 per month.
Conclusion
With a second lockdown ordered in Toronto, and many white-collar employees continuing to work from home, there is not any rapid reversal in rents expected in Toronto or the GTA overall over the next four to six months.
The approval of the COVID-19 vaccine and eventual distribution in early 2021 should start to bring down the number of cases and improve consumer confidence. However, until there are more office buildings full, and the borders reopen, there will not be a rush back into the downtown rental market.
Bullpen Research & Consulting does expect that to occur in 2022, and is forecasting double-digit rent growth for apartments (condo and rental) that year, following a most modest rise in 2021.