Greater Toronto Area Rental Market
The Average Rent for All Property Types in the GTA Increased by 4.3% Annually in November 2021
The top panel in the chart below presents TorontoRentals.com data on the average monthly asking rent for GTA rental listings (all property types: basement apartments, rental apartments, condo apartments, townhouses and single-family homes) from November 2020 to November 2021.
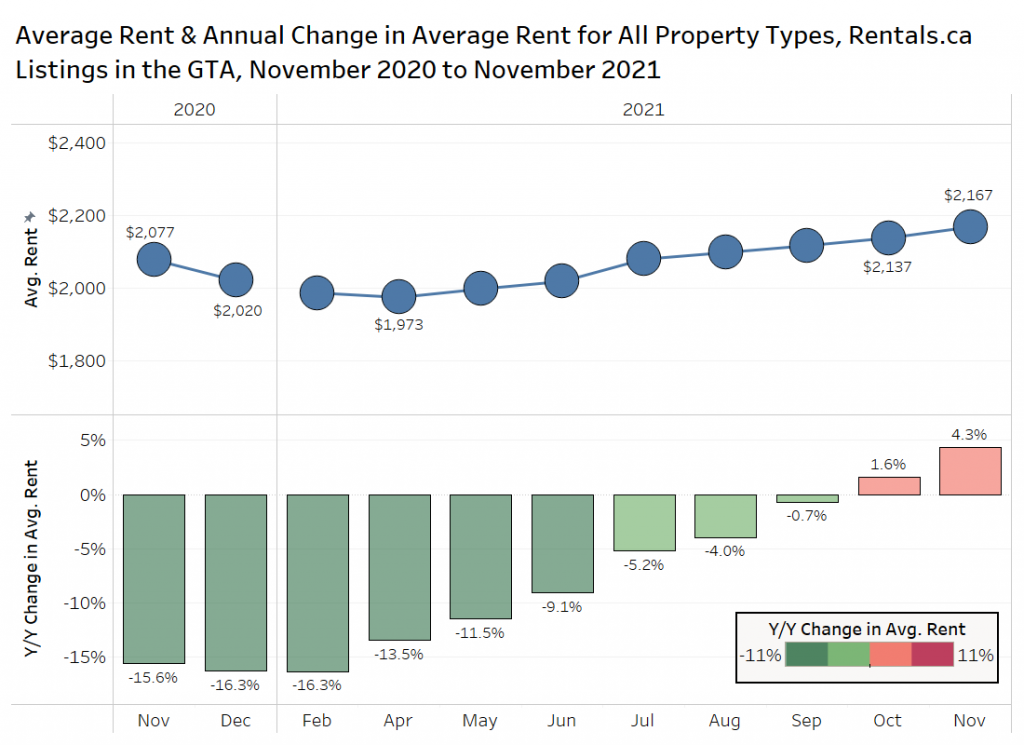
The average rent for all property types was $2,167 per month in November 2021, this represents a year-over-year increase of 4.3% from the November 2020 average of $2,077 per month. This is in stark contrast to the 15.6% annual decline from November of last year.
Average Rental Rates by Bedroom Type
The data presented in the chart below on the average rent in the GTA from June 2021 to November 2021 shows how rents for all bedroom types have recovered over the last six months. Five- and six-bedroom units have been removed from the chart, as the small sample sizes lead to monthly volatility.
Average Asking Rents for Three-Bedroom Units Up 7.3% Annually
In June 2021, the average rent for the smallest bedroom types had declined year over year. The only bedroom type that experienced an increase in average rent was four-bedroom units, which experienced an annual increase of 2.0%. Since the middle of 2021, the year-over-year change in average rent for all property types has gradually increased each month heading toward the end of the year.
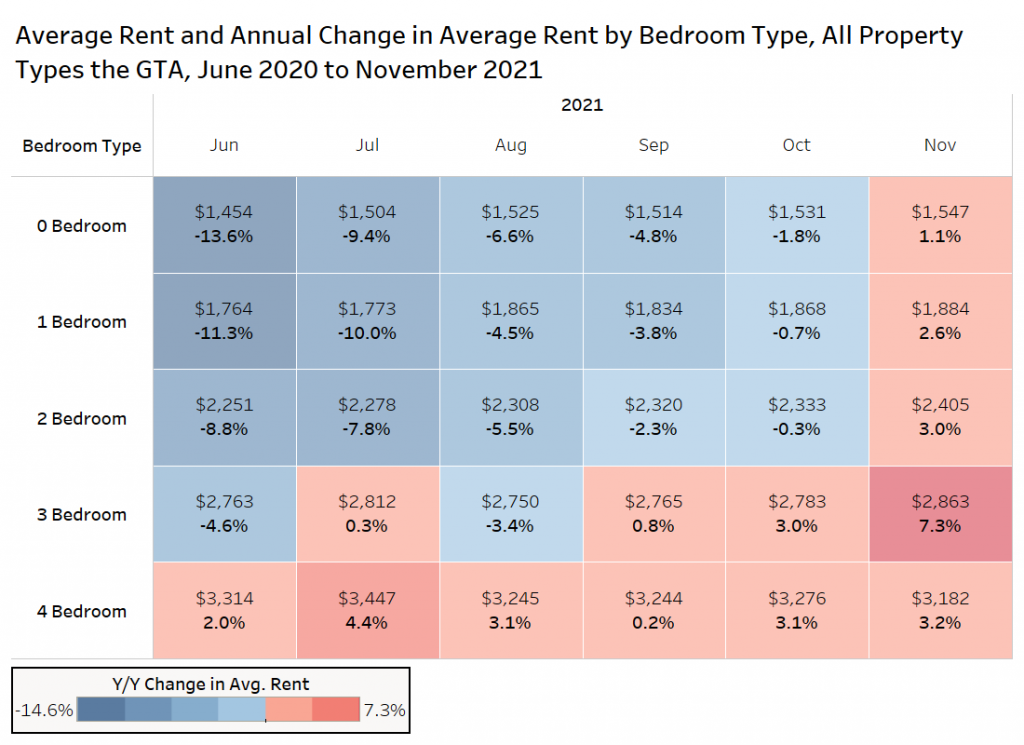
In November 2021, studio units experienced an annual increase of 1.1% to $1,547 per month. One-bedroom units experienced an annual increase of 2.6% to $1,884 per month. Two-bedroom units experienced an annual increase of 3.0% to $2,405 per month. Three-bedroom units experienced an annual increase of 7.3% to $2,863 per month. Lastly, four-bedroom units experienced an annual increase of 3.2% to $3,182 per month.
As many locals continue to work remotely, at least part of the time, larger units have the larger imbalance between supply and demand, leading to higher rent growth.
Average Rental Rates by Property Type
The next figure visualizes GTA data on the average rent for single-family homes, condominium apartments, townhouses and rental apartments in November of 2020 versus November of 2021 via TorontoRentals.com listings data.
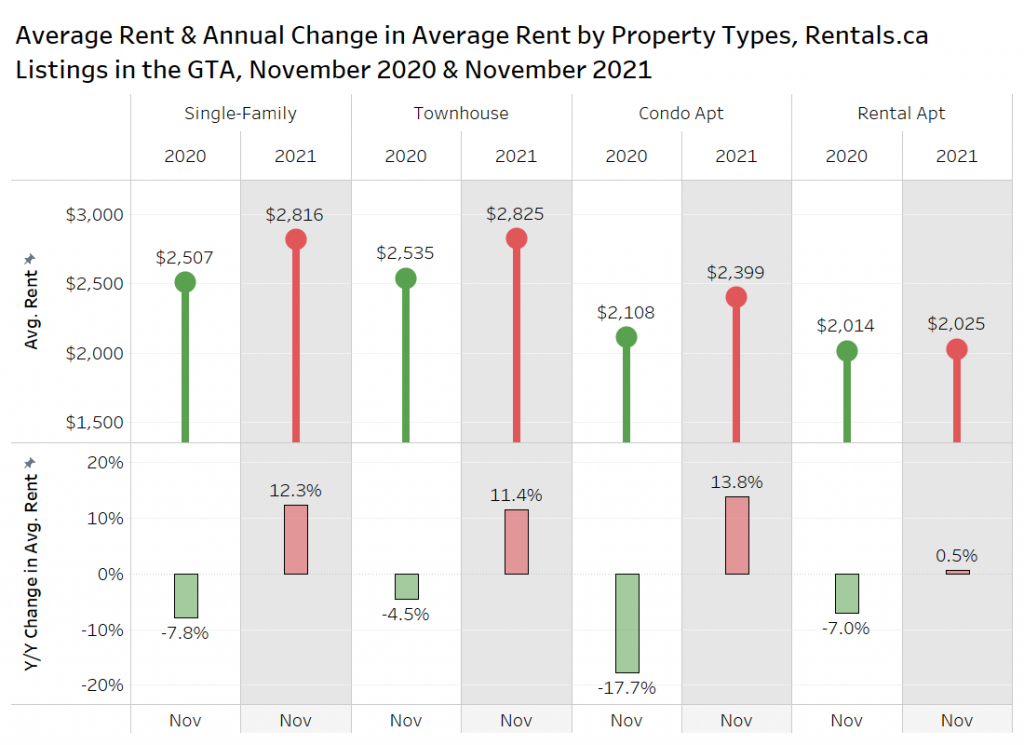
In November of 2020, the average rent for single-family properties in the GTA was just over $2,500 per month, a decrease of 7.8% annually. As of November 2021, average rent has increased by 12.3% year over year to $2,816 per month.
Townhouses had the highest average rent at $2,535 per month in November 2020, a year-over-year decline of 4.5%. In November 2021, townhouses experienced a 11.4% year-over-year increase in average rent to $2,825 per month.
The average rent for condo apartments was down by 17.7% in November 2020 at just over $2,108 per month on average. In 2021, the average rent for condos has increased annually by 13.8% to $2,399 per month, the highest growth among the property types.
Rental apartment average rents dropped to $2,014 in November 2020, an annual decline of 7.0%. In November 2021, the average rent for rental apartments increased by 0.5% to $2,025 per month. While most of the market has experienced significant annual increases in November 2021, rental apartments stand out as the segment of the market that experienced the smallest increase. However, many rental apartment landlords and owners were offering incentives like one or two months of free rent last year, and many of those incentives are now gone, while those incentives were less prevalent from the private or investor market.
Average Rents by Municipality
Average Annual Rent Up 10.7% in Toronto
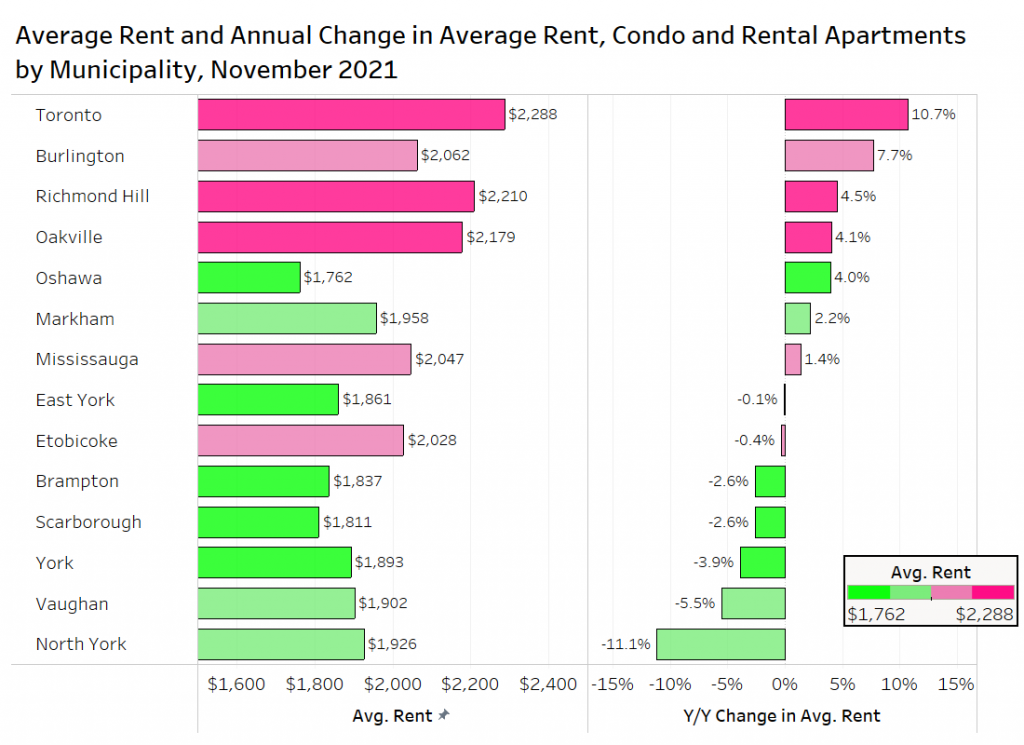
The chart below looks at data on the average rent for condominium and rental apartments in select GTA municipalities in November 2021 (Toronto is broken up into its former municipalities, prior to amalgamation).
Of the municipalities presented, Toronto experienced the largest annual increase at 10.7% to an average rent of $2,288 per month. Burlington also experienced a significant annual increase of 7.7% to $2,062 per month.
North York is the area that has experienced the largest year-over-year decrease at 11.1% to $1,926 per month. It should be noted that some of the decline in North York is compositional, as there were a couple of new purpose-built rental apartment completions late last year, and as those projects slowly leased up, these more expensive unit listings were pulled from TorontoRentals.com.
Vaughan was another area that experienced a significant decline in average rent at 5.5% to $1,902 per month — one of the reasons for the lower rent is a number of condo completions with small units that pull the average down.
Average Rental Rates by Rounded Unit Size in Toronto
The average rent and average rent per square foot for condominium and rental apartments by rounded unit size is summarized in the chart below. Suites from 450 square feet to 1,049 square feet are rounded to the nearest hundred to examine the asking rents in November 2019, November 2020 and November 2021.
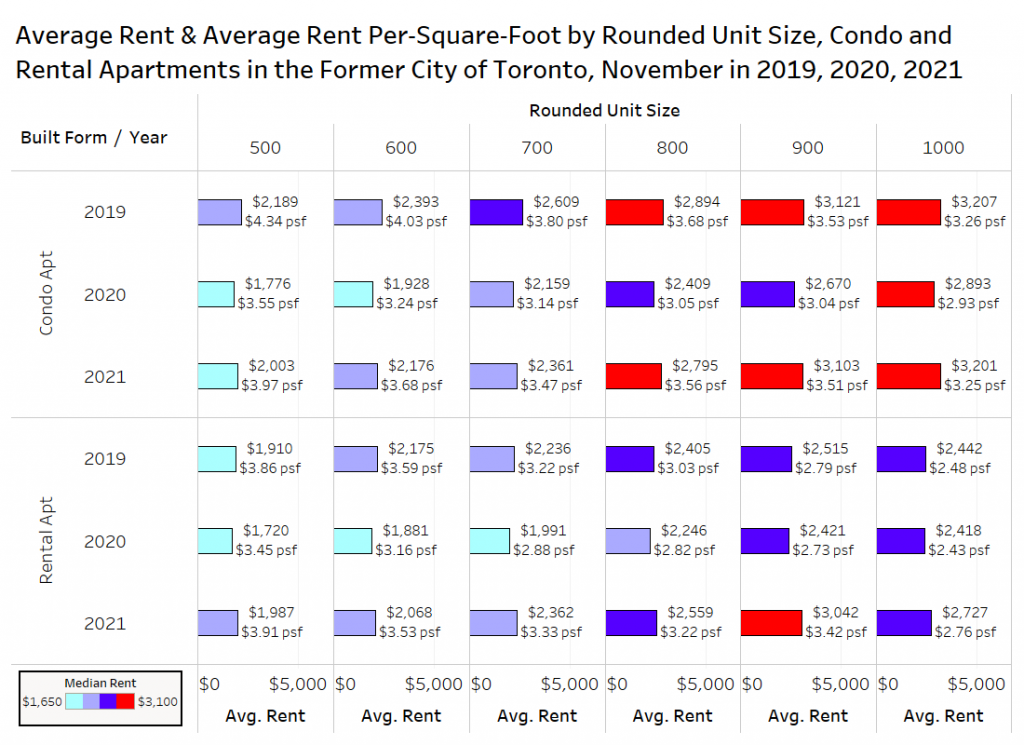
The average rents as well as the average rents per square foot for condo apartments across all rounded unit sizes have increased annually in 2021. Condo apartments with a rounded unit size of 900 square feet experienced the largest annual increase, moving from $2,670 per month to $3,103 per month. The larger units (900 square feet and 1,000 square feet) nearly got back to 2019 rent levels.
Similarly, the average rents as well as the average rents per square foot for rental apartments across all rounded unit sizes have also increased annually in 2021. Rental apartment units with a rounded unit size of 900 square feet experienced the largest increase in average rental rate, moving from $2,421 per month in 2020 to $3,042 per month in 2021. Only 600-square-foot units remain below the 2019 rent levels.
Condo and Rental Apartment Per-Square-Foot Rent Levels
In Downtown Toronto, condo apartments have moved from a low of $3.11 per square foot in January 2021 to $3.69 per square foot in November. Rental apartments ended 2020 with an average rent per square foot of $3.17 before hitting a low of $3.09 in July 2021. In November 2021, the average rent per square foot has moved up to $3.36.
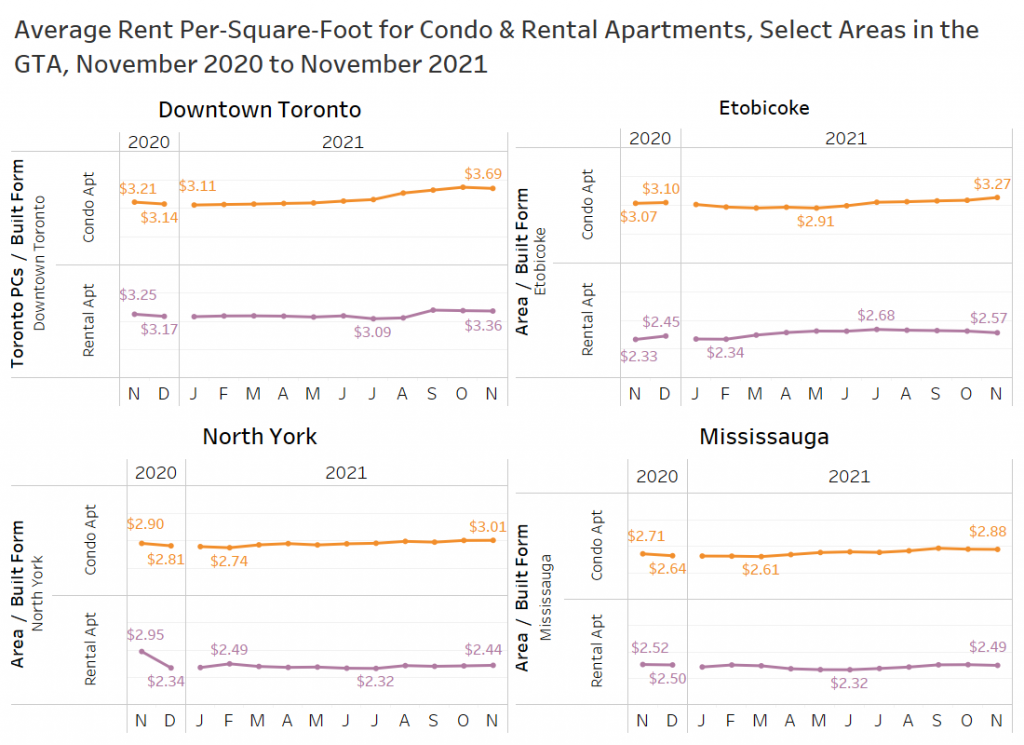
In Etobicoke, condo apartments ended 2020 with an average rent per square foot of $3.10. A local low of $2.91 per square foot was hit in May 2021. In November 2021, the average rent per square foot increased to $3.27. Rental apartments have moved from $2.34 per square foot earlier in 2021 up to a high of $2.68 per square foot in July. In November 2021, the average rent per square foot landed at $2.57.
In North York, the average rent per square foot has moved from $2.74 in February 2021 up to $3.01 in November 2021. Rental apartments in North York have seen their average rent per square foot move from $2.49 earlier in the year down to $2.44 in November 2021.
In Mississauga, the average rent per square foot at the end of 2020 was $2.64, which continued to decline for several months to a low of $2.61 in March 2021. Since then, the average rent per square foot has gradually increased to $2.88 in November 2021. Rental apartments have not changed much, moving from $2.50 per square foot at the end of 2020 to $2.49 in November 2021, bottoming out at $2.32 mid-year.
Market Share of Listings by Bedroom Type in Downtown Toronto
The chart below looks at the market share of condo apartment listings in downtown Toronto by quarter from 2019 to 2021. Note that Q4-2021 is October and November only.
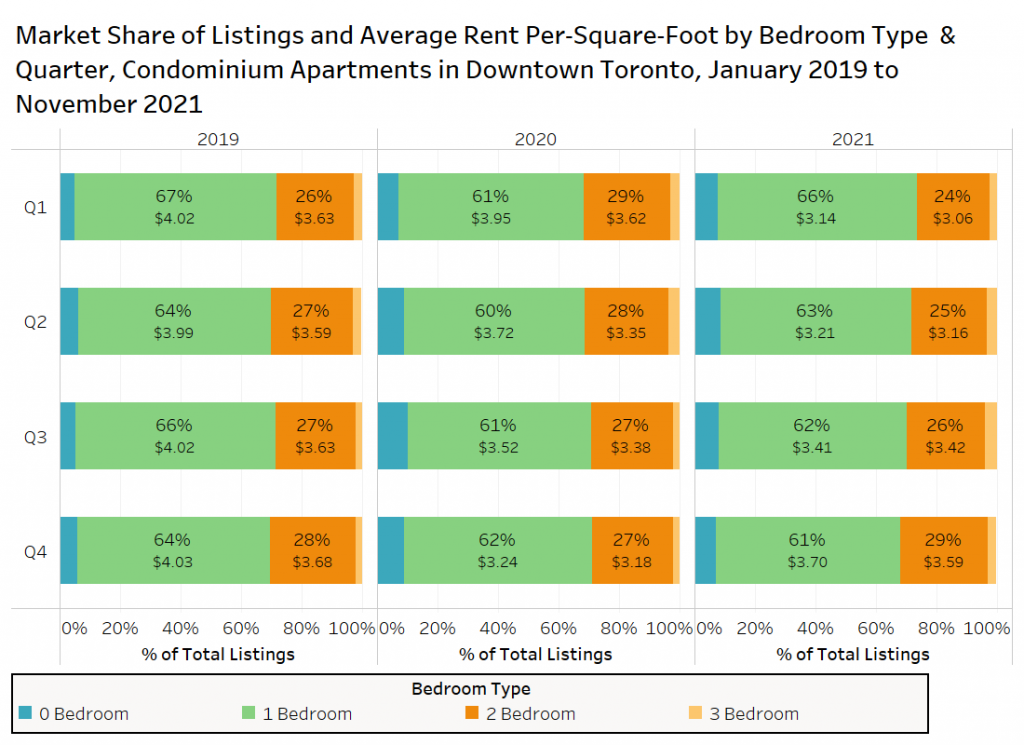
The most noticeable recent change or divergence from the norm can be seen in the first quarter of 2021, as one-bedroom units moved from 61% of the market share in Q1-2020 to 66% of the market share in Q1-2021, while two-bedroom units moved from 29% of the market share in Q1-2020 to 24% of the market share in Q1-2021. Early in the pandemic, small units were less popular, and thus the listings grew on TorontoRentals.com.
The market share distribution in the fourth quarter of 2021 has more or less reverted to what it was in the first quarter of 2020 — 7% studio units, 61% one-bedroom units, 29% two-bedroom units, and 3% three-bedroom units.
Average Rental Rates for New Apartment Projects
The bar graph below looks at the average rent, average unit size, and average rent per square foot for a select number of condominium and purpose-built rental apartments completed (or started pre-leasing) over the past three years.
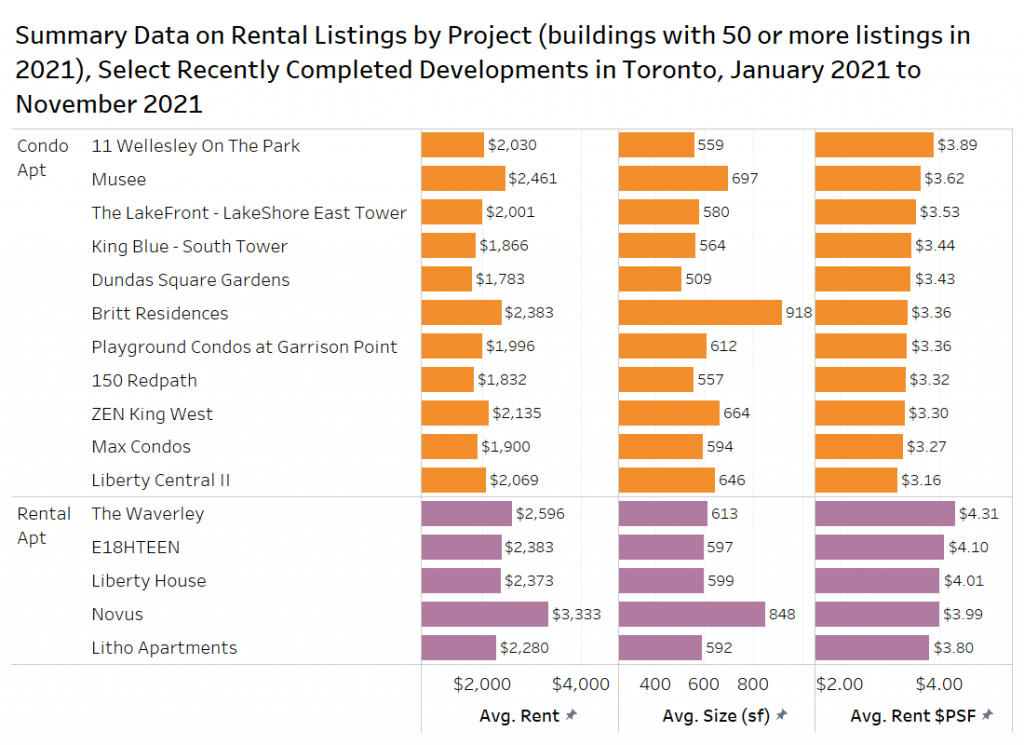
The condo development with the highest average rent per square foot was 11 Wellesley On The Park at $3.90. Units in this development generally had an average rent of $2,030 per month and were 559 square feet on average.
The rental apartment project that had the highest average rent per square foot was The Waverley at $4.31. Units in this development had an average rent of $2,596 per month and were on average 613 square feet in size.
Rent Forecast
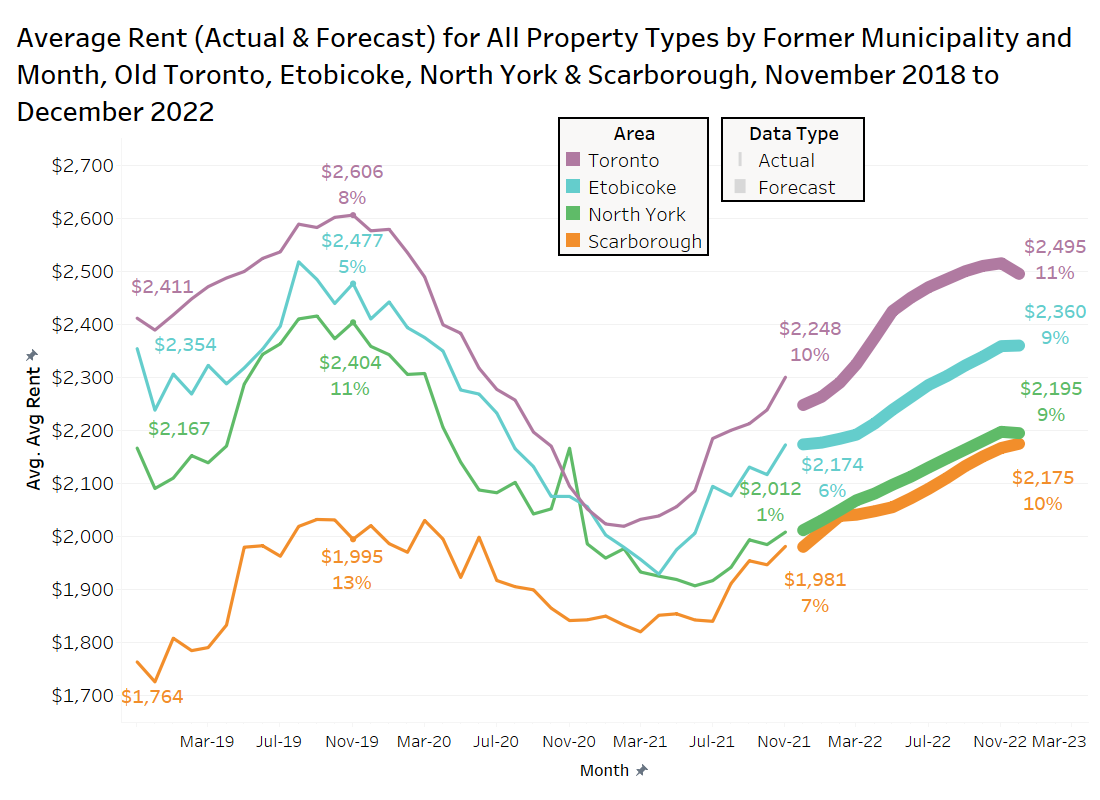
The following chart looks at the average rent for all property types in the former municipalities of Toronto, Etobicoke, North York and Scarborough from November 2018 to November 2021 (thin line), with the thicker line representing the Bullpen Research & Consulting and Rentals.ca forecasts for the next 13 months. These are the forecasts for the prime ‘416’ areas.
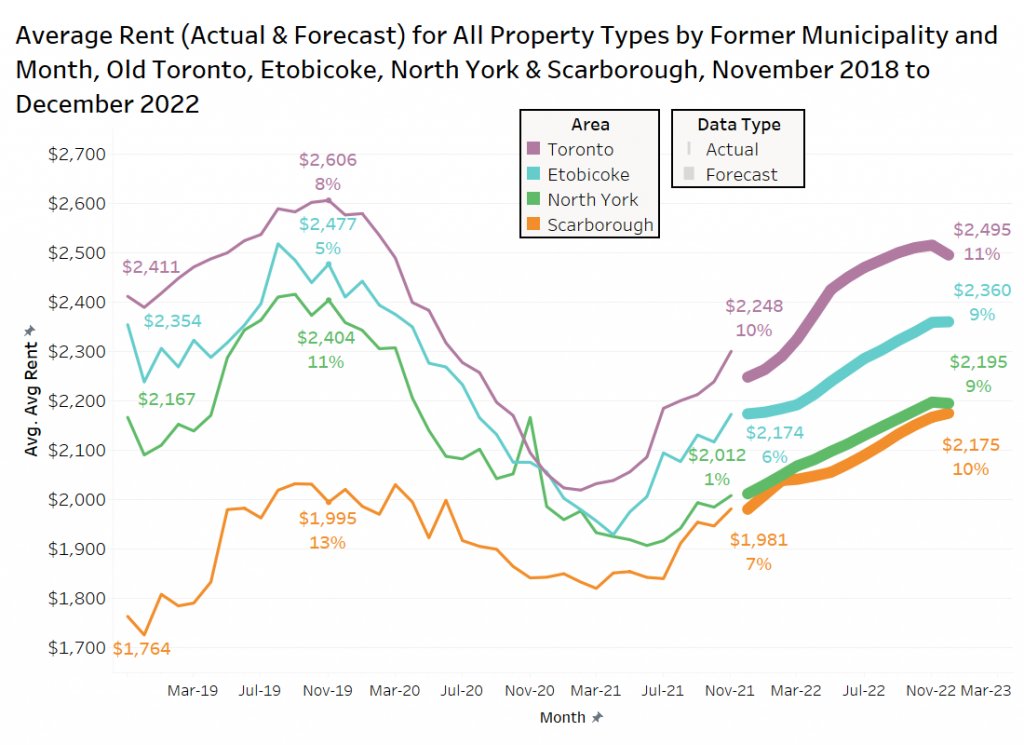
Toronto is forecasted to have a strong bounceback in 2022, as the forecast calls for an annual increase in the average rent of 11% next year to $2,495 per month. This is similar to how the rental market in Toronto has performed throughout 2021, posting an annual increase of 10% this year following the major declines during the pandemic-impacted 2020.
Similar growth rates are expected in the other three former municipalities, with Etobicoke slated to grow by 9% to an average rent of $2,360 per month, North York forecasted to grow 9% to $2,195 per month, and Scarborough expected to grow 10% to an average monthly rent of $2,175 per month.
Also marked on the chart is the average rent and annual growth rates from November 2019, which shows that these municipalities will likely finish 2022 with average rents below their highs from three years ago. The growth rates forecast in 2022 will be below the 2019 growth rates in North York and Scarborough, while the 2022 growth rates in Toronto and Etobicoke are expected to be greater than those in 2019. Despite the expected growth, the average monthly rental rates in all four areas is expected to still be below the average rents in 2019.
The chart below looks at forecasts for four municipalities in the GTA suburbs, including Oakville, Mississauga, Markham and Vaughan. It should be mentioned that rental rates in Oakville can be volatile due to the changing composition of listings that can include luxury downtown projects, waterfront low-rise properties, and the budding north Oakville investor condo market, which features small units.
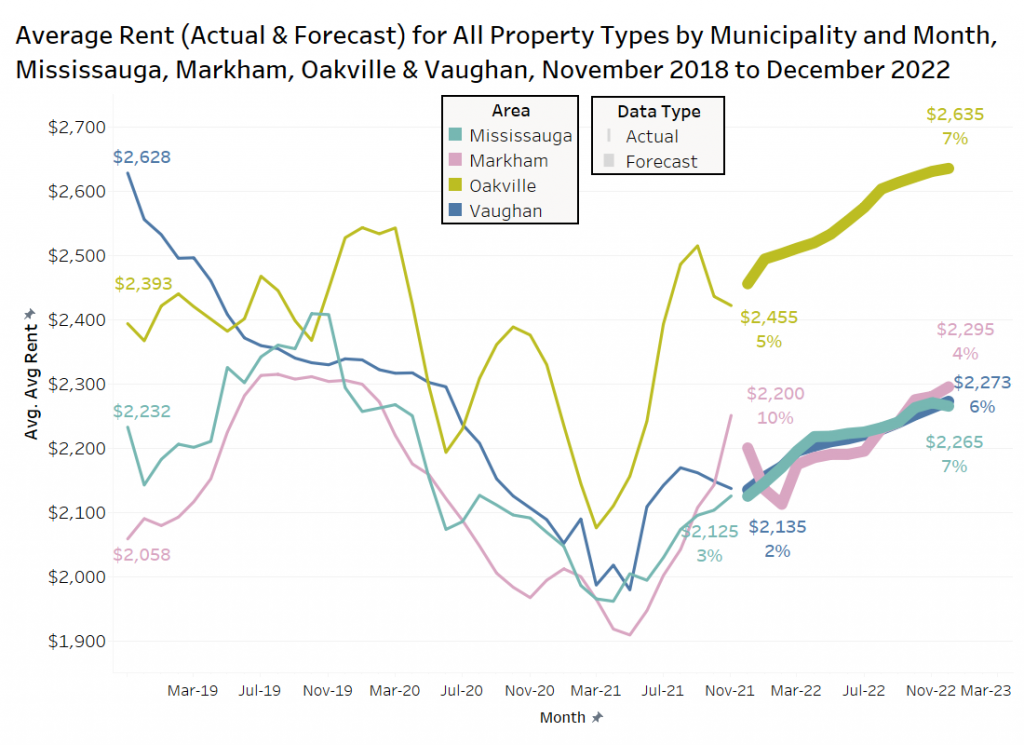
The rent forecasts in the suburbs are more modest than the City of Toronto forecasts, as these ‘905’ area markets didn’t experience declines as steep as the ‘416’ area markets.
Rent in Oakville is expected to rise 7% to $2,635 per month, while Markham is expected to rise 4% to $2,295 per month. Rents in Mississauga are expected to rise 7% to $2,265 per month. Lastly, rents in Vaughan are expected to rise 6% to $2,273 per month.
Conclusion
The average rent in the GTA increased annually by 4.3% to $2,167 per month in November. This is the second month in a row that the average rent has experienced a year-over-year increase. Over the past six months, the average rent for three- and four-bedroom units have experienced annual increases. In November 2021, all bedroom types experienced an annual increase in average rent, reinforcing the idea that the market is recovering from the adverse pandemic effects.
Single-family homes, townhouses, condo apartments, and rental apartments all had average rents higher in November 2021 compared to November 2020, with the most notable increase in condo apartments (experiencing an annual increase of 13.8%).
Toronto experienced the greatest annual increase in average rent in November 2021 at 10.7%, followed closely by Burlington at 7.7%. North York experienced the largest annual decline in average rent at 11.1%.
After shifting toward more one-bedroom units being listed in Q1-2021, the market share of one-bedroom units has slowly declined to 61% in Q4-2021 while the market share of two-bedroom units has slowly increased from 24% to 29%. This suggests that the number of tenants leaving two-bedroom units is slowly increasing as more tenants stay in their one-bedroom units — likely a by-product of changing working conditions and increasing rents.
Bullpen and Rentals.ca expects the ‘416’ areas of the GTA to experience growth in rental rates of approximately 10% in 2022, while the ‘905’ areas of the GTA are expected to experience between 4% and 7% growth in monthly rental rates.
Disclaimer
The information, statements, statistics and commentary contained within this report that was prepared by Bullpen Research & Consulting Inc. (“Bullpen”) utilized data and information from various secondary sources, as well as various discussions with industry participants. Bullpen based this report on information received or obtained, on the basis that such information is correct. Bullpen does not warrant the accuracy or completeness of the information provided or any assumptions or conclusions made by the parties that provided the information.
While Bullpen made every effort to present accurate and reliable information in all the material as provided, Bullpen does not endorse, approve, or certify such information, nor does it guarantee the accuracy, completeness, efficacy, timeliness, or correct sequencing of such information. Use of such information is voluntary, and reliance on the information should only be undertaken after an independent review. Reference herein to any specific information, material or otherwise provided, does not constitute or imply endorsement, recommendation, or favouring by Bullpen.
Bullpen assumes no responsibility, financial or otherwise, for consequences resulting from the use of the material or information herein, or in any respect for the content of such information, including (but not limited to) errors or omissions, the accuracy or reasonableness of factual or scientific assumptions, studies or conclusions, research, the defamatory nature of statements, ownership of copyright or other intellectual property rights, and the violation of property, privacy, or personal rights of others. Bullpen is not responsible for, and expressly disclaims all liability for, damages and/or losses and/or risks, personal, professional, commercial or of any kind arising out of use, reference to, or reliance on such information. No guarantees or warranties, including (but not limited to) any express or implied warranties of merchantability or fitness for a particular use or purpose, are made by Bullpen with respect to such material and/or information. Bullpen and any sub-consultant contracted for this report make no warranty or representation regarding the results or performance that may be obtained from the use of the material or information as provided and/or regarding the accuracy or reliability of any information, or that Bullpen and the sub-consultant’s information or material will meet any user’s requirements, be uninterrupted, timely, secure or error-free. Bullpen reserves the right to change any information or material without notice or warranty.