Greater Toronto Area
The rental market in the Greater Toronto Area continues to be impacted by COVID-19, as job loss, economic uncertainty, and fear of moving for health reasons have severely reduced demand.
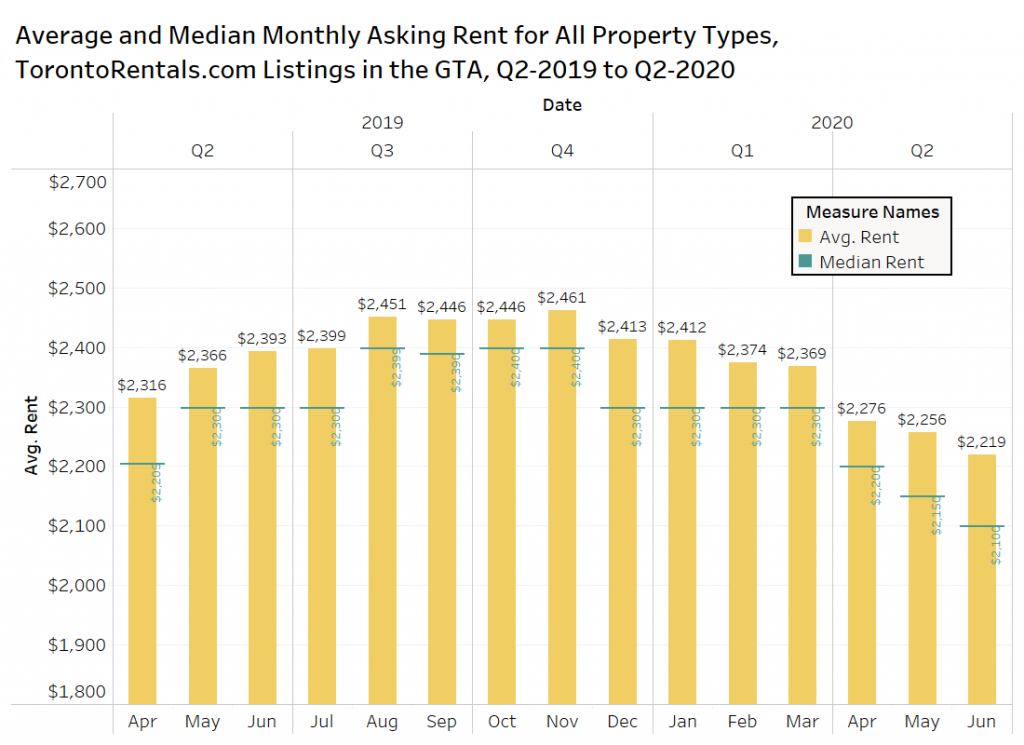
The chart below looks at the average (yellow) and median (green) monthly asking rent via TorontoRentals.com listings for all property types (basement apartments, rental apartments, condo apartments, townhouses and other single-family homes).
The average rent was $2,219 per month in June, the 7th consecutive monthly decline. The average rent is down 1.7% monthly, and 7.3% annually. The median rent is down 2.3% monthly and 8.7% annually.
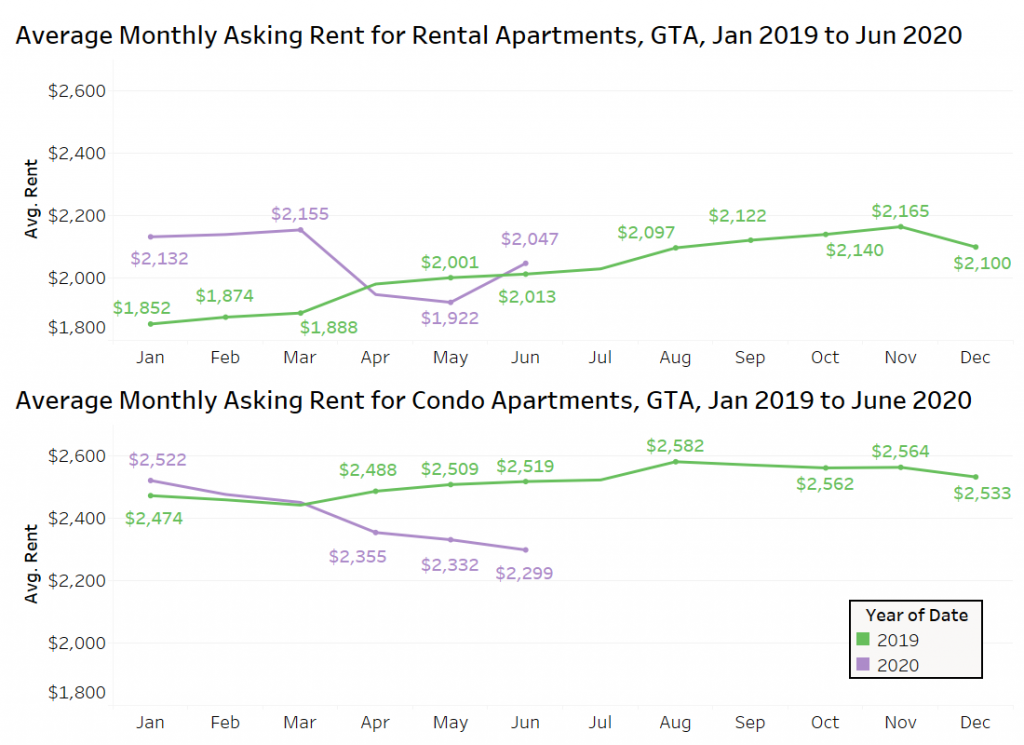
Average Rental Rates by Property Type
Not all property types in the GTA are seeing the same downward trend. Rental apartment lease rates grew month over month in the GTA from $1,922 to $2,047, a monthly increase of 6.5%. The average monthly rent was up 15% year over year in January, but fell all the way to -4% annually in May, however, rents are now above the June 2019 level by 1.7%.
The bottom panel shows that condominium apartments did not experience the same bounce back in June, as rents declined 1.4% monthly and 8.7% annually.
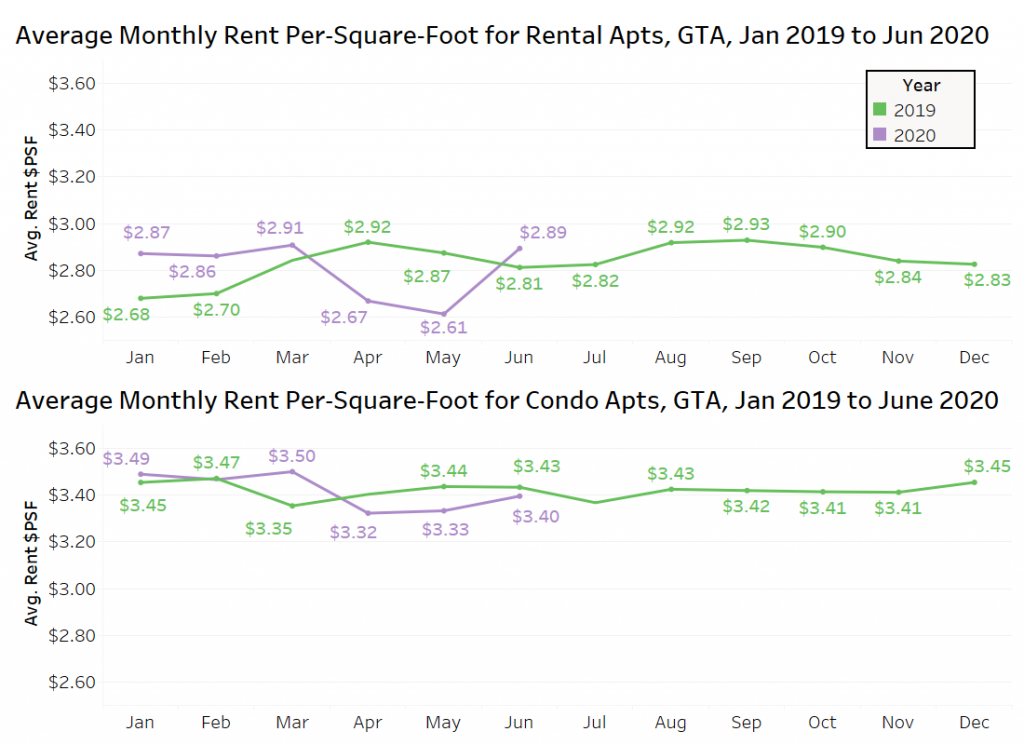
Rent Per Square Foot
One of the biggest issues with comparing average rent levels over time is the changing composition of the sample of listings on a monthly basis. In the resale housing market, luxury units don’t sell as frequently in a down market, making the average price drop look worse than it is, while the opposite is the case in a strong market.
The sample of listings used for analysis in this blog post eliminates units listed above $5,000 per month to prevent some of these outliers from impacting the average, but there are a number of newly completed buildings in Toronto with small units pulling the average suite size down, this impacts the rent per square foot.
The figure below looks at rent per square foot for rental apartment and condominium apartments in the GTA in 2019 and year to date in 2020. Keep in mind that the landlord or owner doesn’t always list the suite size for all of the listings, so this is based on a smaller sample size of listings in comparison to the charts above.
The rent per square foot for rental apartments in the GTA increased by a whopping 10.7% monthly in June, and is now back above the 2019 rent levels (+2.9%).
Rent per square foot for condo apartments has actually increased in each of the last two months, rising 1.9% month over month in June to $3.33 per square foot. However, the average rent level is still below the 2019 pace in June (-1.1% year over year).
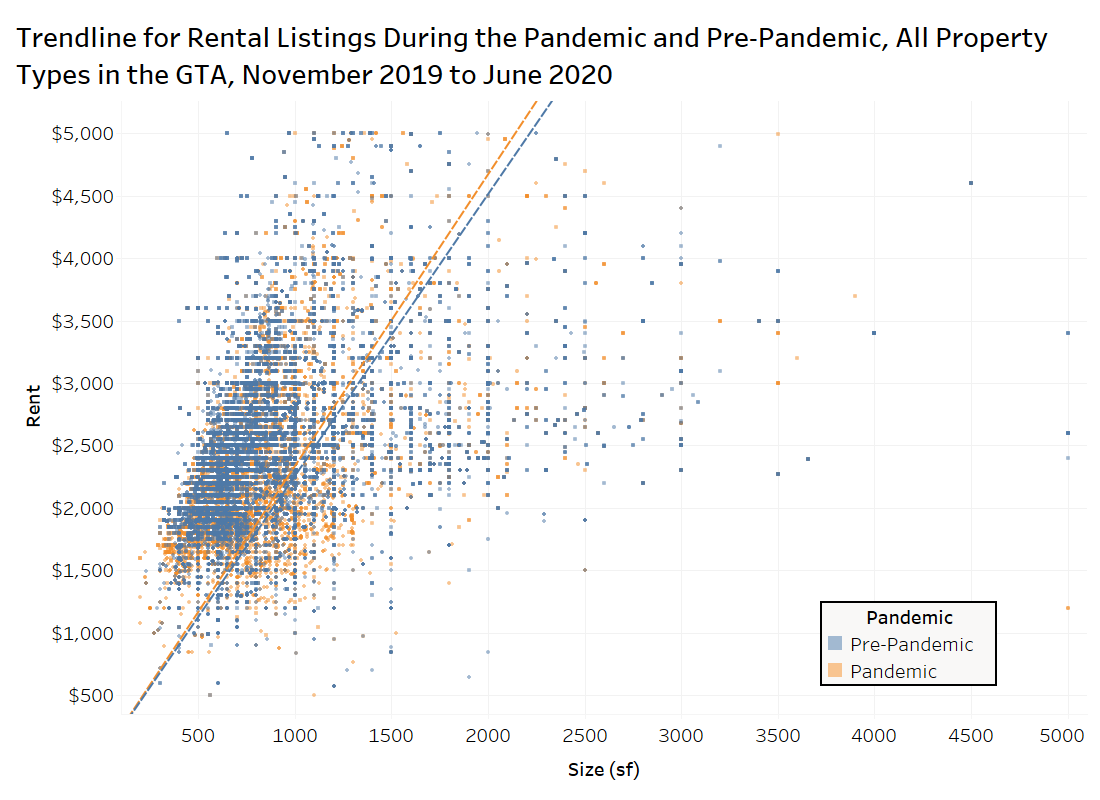
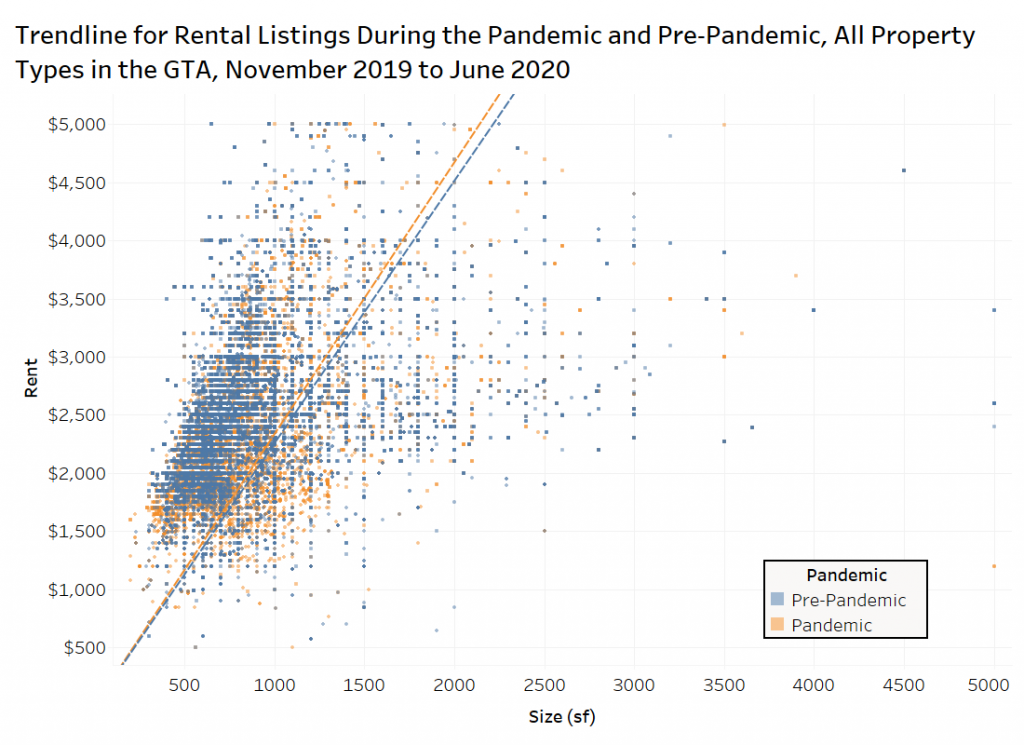
Pandemic versus Pre-Pandemic Rent Levels
When evaluating the movements in the ownership or rental markets, there is always a focus on average and median rent levels. However, these measures don’t always tell the full story because of the sample used to gauge those movements. As mentioned earlier, there can be large movements in the composition of units every month: changes in the average unit size, changes in the average bedroom type, changes in the property type, change in lot sizes, changes in balcony sizes, changes in the average age of the buildings, changes in the standard interior finishes, and changes in the number of common amenities in the apartment or nearby.
You would never be able to control for all of these factors, but another way to look at the data is via a scatter plot showing the rent for all Rentals.ca listings on the vertical axis and the unit size on the horizontal axis. The chart includes a linear trendline that is forced to zero, showing the pre-pandemic period (November 2019 to February 2020), and pandemic period (March to June of 2020).
The two trendlines in blue (pre-pandemic) and orange (pandemic) are nearly overlapping, and the pandemic line is slightly higher, showing that for each additional square foot, a tenant would have to pay $2.34 in the GTA. Before the pandemic each additional square foot would cost a tenant $2.35. That said, some (or most) of the difference could simply be seasonal, as the rental market from November to February is typically slow.
Doing the same chart for condominium apartments only, the pre-pandemic increase was $3.10 per square foot, while the pandemic increase is $3.05 per square foot. As an example, a 500-square-foot unit would have been offered for rent at $1,550 per month in the four months before the pandemic, and $1,525 during the pandemic, a $25 monthly saving, or a 1.6% discount.
However, some landlords are offering further discounts like one or two months free to entice tenants. These incentives are not being captured or netted out of the rental data in our analysis.
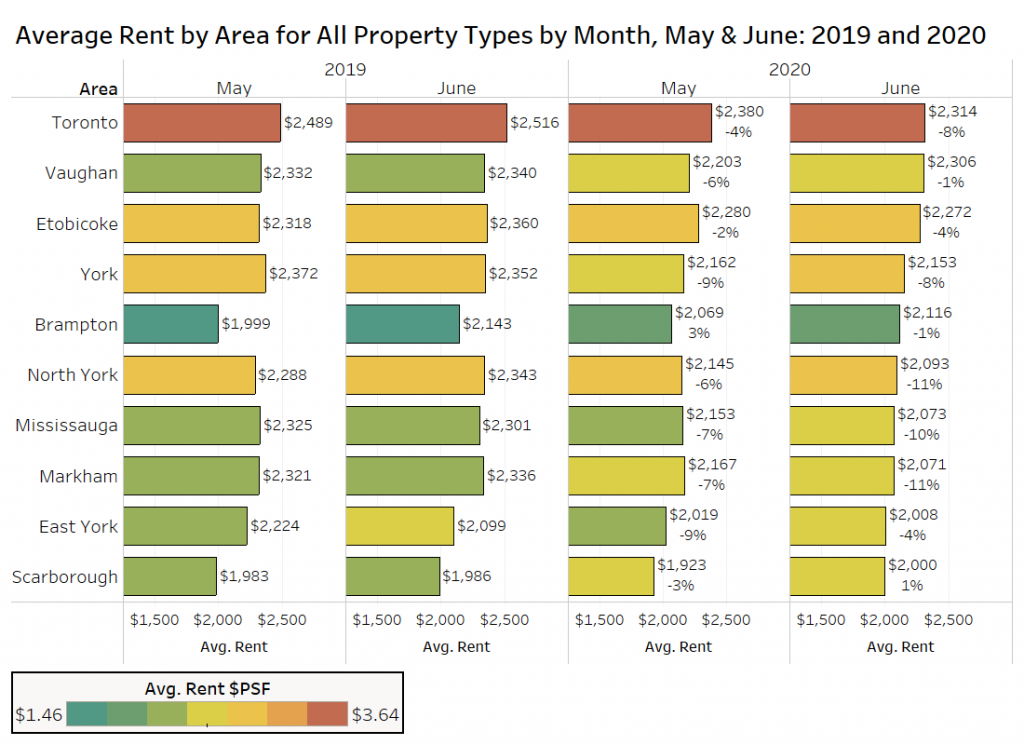
Average Rental Rates by Area
The chart below looks at the average rent for all property types (singles, semis, row, condo apartment, rental apartment, basement apartment) by municipality and former municipality in the GTA in May and June in 2019 versus May and June in 2020.
Three areas are experiencing double-digit annual rent drops: North York and Markham at 11% and Mississauga at 10%. The former City of Toronto (pre-amalgamation boundaries) is down 8% year over year, as is York. The only market with higher rents than last year is Scarborough (+1%).
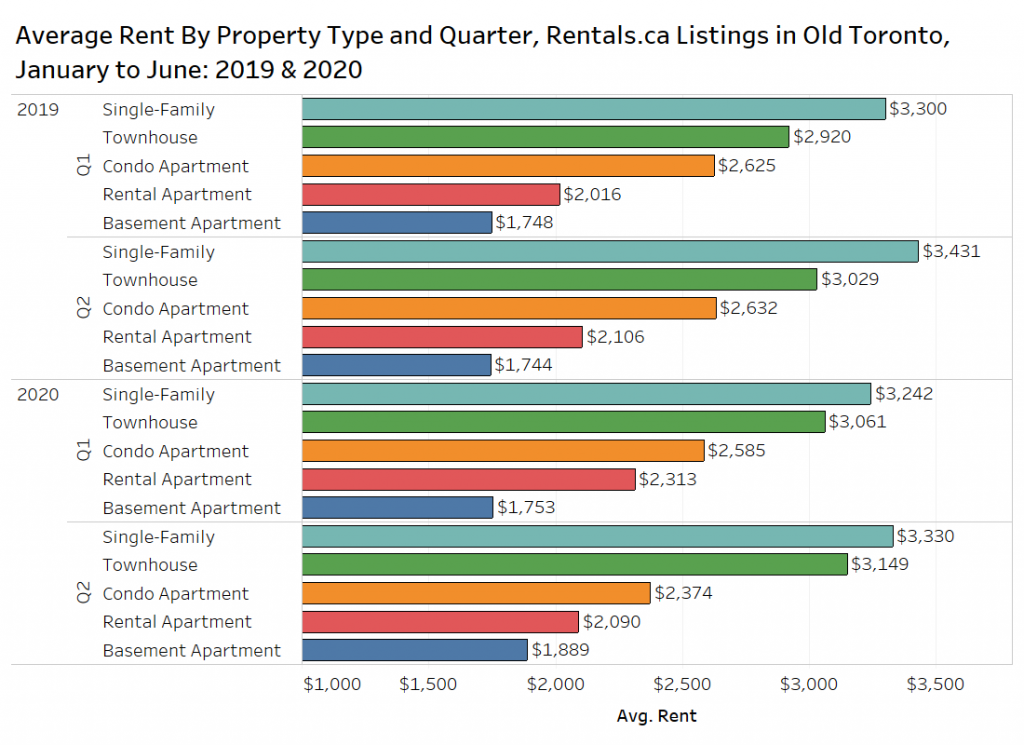
Rental Rates by Property Type in Old Toronto
Within the former City of Toronto (also referred to as old Toronto), the pandemic-impacted second quarter has seen asking rents increase for single-family, townhouse and basement apartment listings on TorontoRentals.com over the first quarter.
For tenants looking for a high quality unit, condominium apartments for rent were nearly $260 per month cheaper in the second quarter of 2020 compared to the same period last year.
Despite the pandemic, on average, a tenant would only be saving about $15 on a purpose-built rental apartment compared to a year earlier.
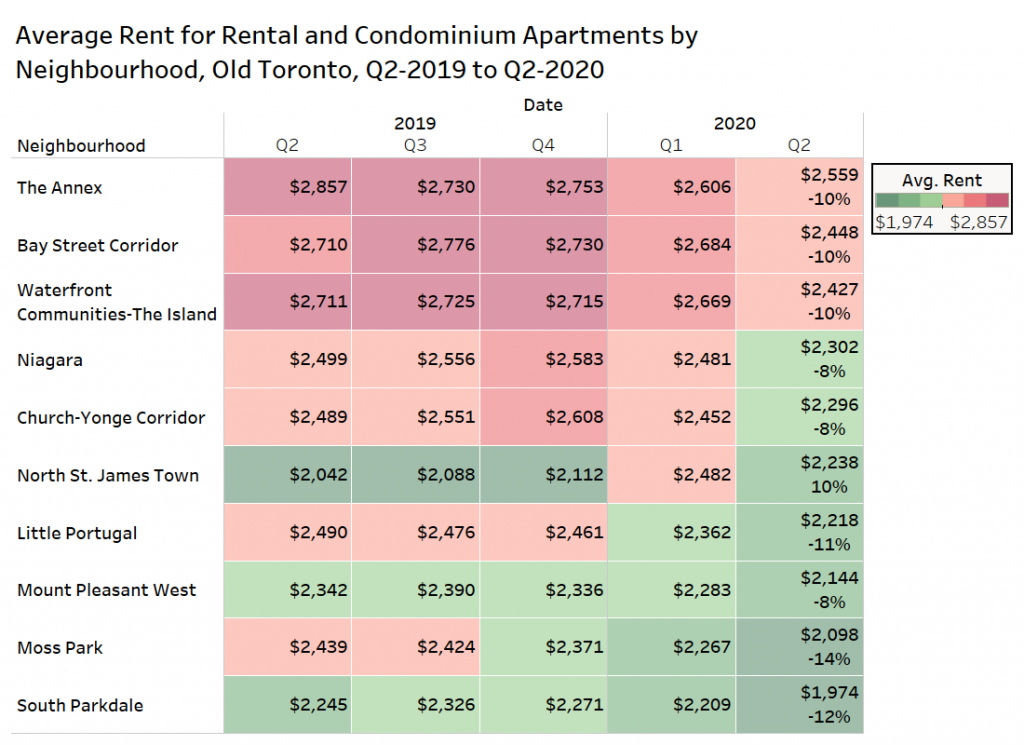
Rental Rates by Neighbourhood in Toronto for Condo & Rental Apartments
The table below examines a number of Toronto neighbourhoods, looking at the average rent for condominium and rental apartments by quarter since Q2-2019.
The rent declines are fairly consistent across the board, with eight of the 10 areas dropping by 8% to 12% annually. Rents are up 10% annually in North St. James Town, but the area was boosted by an increase in the number of listings on TorontoRentals.com at the new high-end purpose-built rental apartment called The Selby on Sherbourne, south of Bloor.
The biggest decline was seen in the Moss Park area with a 14% annual decline. A condominium apartment at 320 Richmond Street East called The Modern, which was one of the most active projects in terms of monthly listings in that area, witnessed a 20% rent decline annually.
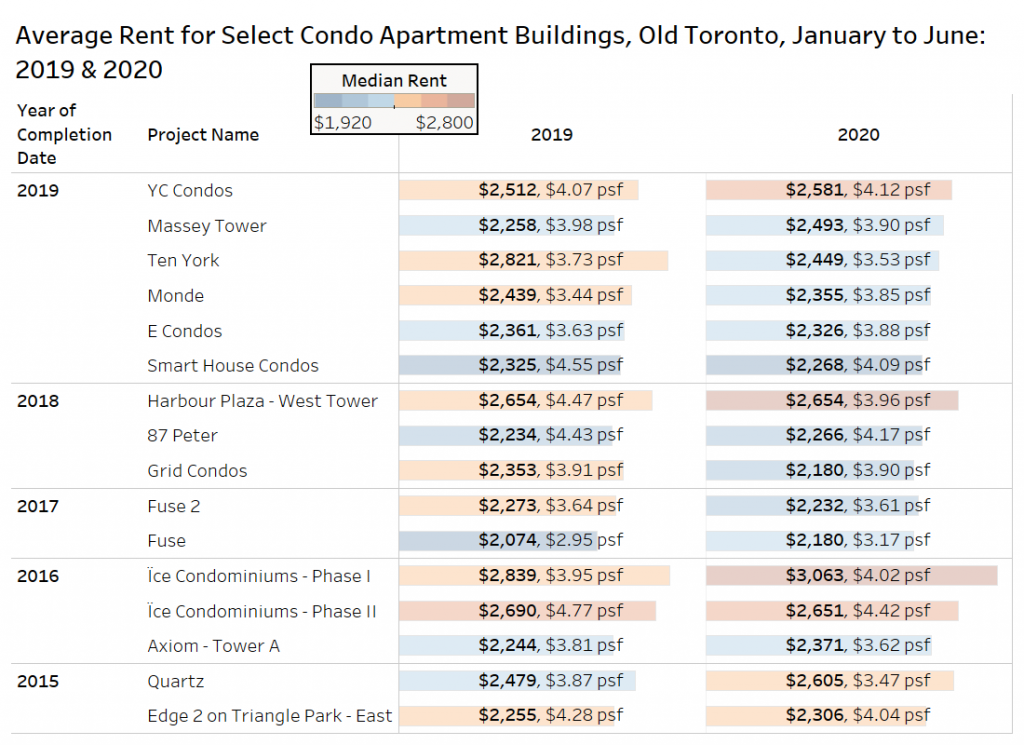
Rental Rates for Active Condo Projects
When trying to evaluate the market on an apples-to-apples basis, looking at the individual projects can assist in that, as this allows for the control over location and interior finish of the suites.
The chart below looks at the average rent and average rent per square foot for several high-activity condo developments in the City of Toronto, with data from January to June 2019 versus January to June 2020. The year of completion was estimated based on available information.
One of the most active condo projects on TorontoRentals.com with over 100 listings in both periods is YC Condos — the building’s address is 7 Grenville Street, right on Yonge Street in downtown Toronto (Bay Street Corridor neighourhood). Average rent at YC Condos is up 2.7% annually, and rent per square foot is up 1.2% annually.
The most active of the projects completed in 2018 is Grid Condos at 181 Dundas Street East in the Moss Park neighbourhood. The average rent is down 7.4% annually, but rent per square foot is nearly identical in the two periods at $3.90 per square foot.
Conclusion
When looking at data on the average rent for all property types in the Greater Toronto Area, the market continues to experience a decline. However, when breaking down the data by property type, municipality, neighbourhood, and project, conflicting results arise. It appears the worst for the rental apartment market is behind us (from a landlord’s perspective), as lockdown restrictions are ended, and demand returns to the market. Average rent per square foot for rental apartments in the GTA increased by nearly 11% month over month, and is higher than June 2019, nearly fully recovering from its pandemic-related decline.
On the other hand, condominium apartment rents continue to experience rent deflation, as the much talked about short-term units hit the full-time rental market, students stay home, immigration is low, and new supply hits the market. The 2,229 condominium apartment completions in May was the third highest monthly total over the last three years per CMHC data, and a significant portion of those units were purchased by investors and are hitting the rental market.
It will still take several months to assess the damage done to the market by COVID-19, when all of the GTA enters Stage 3 of the re-opening, and we are able to see data on how many employees are hired back to their previous jobs, and how quickly consumers start spending again.