Greater Toronto Area Rent Levels
The following analysis looks at aggregated data based on TorontoRentals.com listings from $500 to $5,000 a month for single-family homes, townhouses, rental apartments and basement apartments.
The figure below presents data on the average and median monthly asking rents for GTA rental listings (all property types: basement apartments, rental apartments, condo apartments, townhouses and single-family homes) from January 2019 to June 2021.
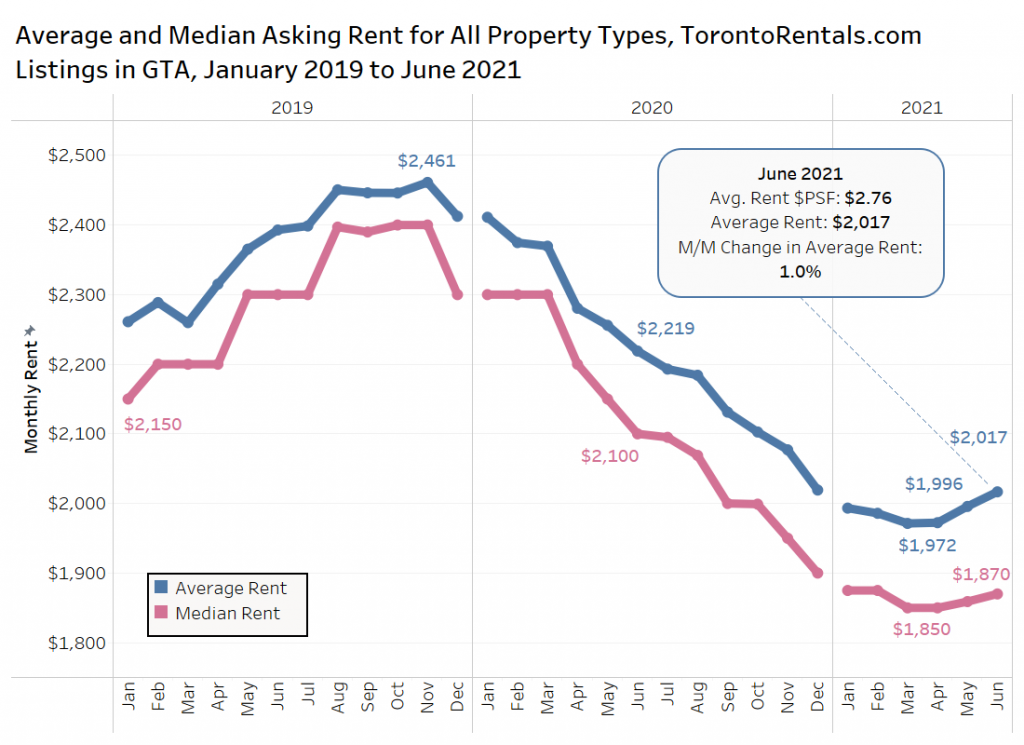
The average rent for all property types was $2,017 per month in June 2021. After experiencing steady declines from November 2019 ($2,461), the average rental rate in the GTA appears to have bottomed out in March 2021 before slowly increasing month over month heading into June. June saw the average monthly rental rate in the GTA experience a 0.9% month-over-month increase. However, the average rent in the GTA is $200 lower than June 2020 (-9%).
Per-Square-Foot Rent Levels in the GTA
The figure below looks at the average and median rent per square foot for all property types in the GTA from January 2019 to June 2021.
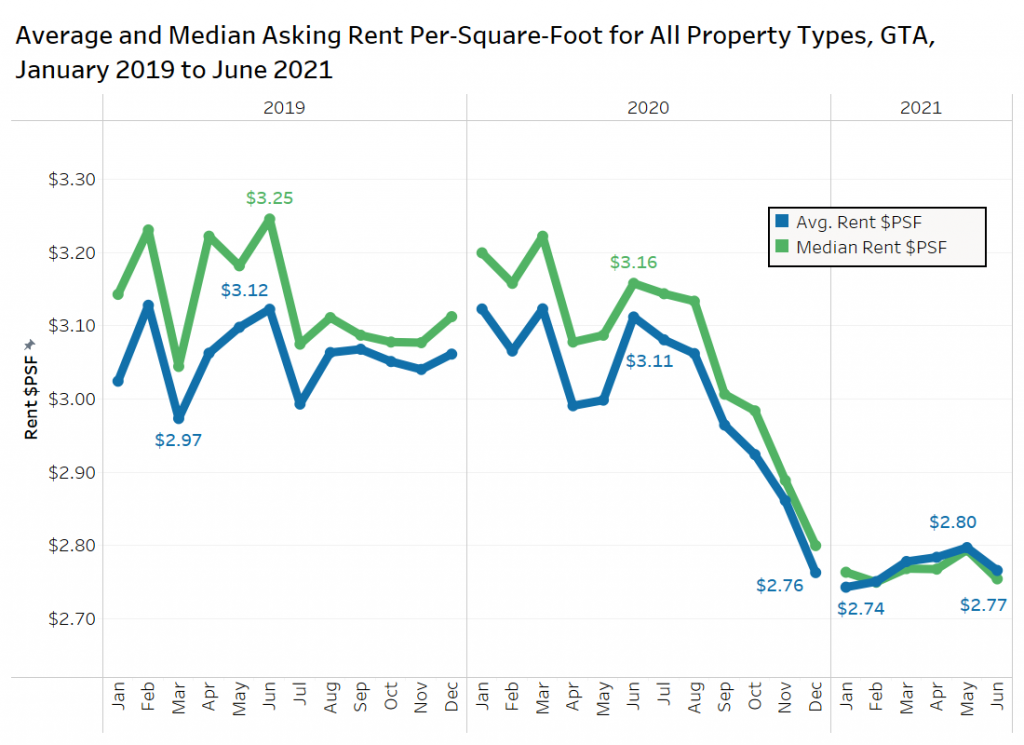
For the majority of 2020, the average rent per square foot steadily declined aside from a brief period around June 2020. The average rent per square foot reached a low of $2.74 in January 2021 before beginning a slow and steady gradual increase leading into May 2021. June saw the average rent per square foot in the GTA decrease 1% month over month, however the recent increases combined with the relaxing of pandemic restrictions suggests that this is more of a hiccup than a reversal of trends.
Average Rental Rates by Property Type in the GTA
The following figure presents GTA data on the average rent for single-family homes, condominium apartments, townhouses, rental apartments and basement apartments from March to June 2021 of this year.
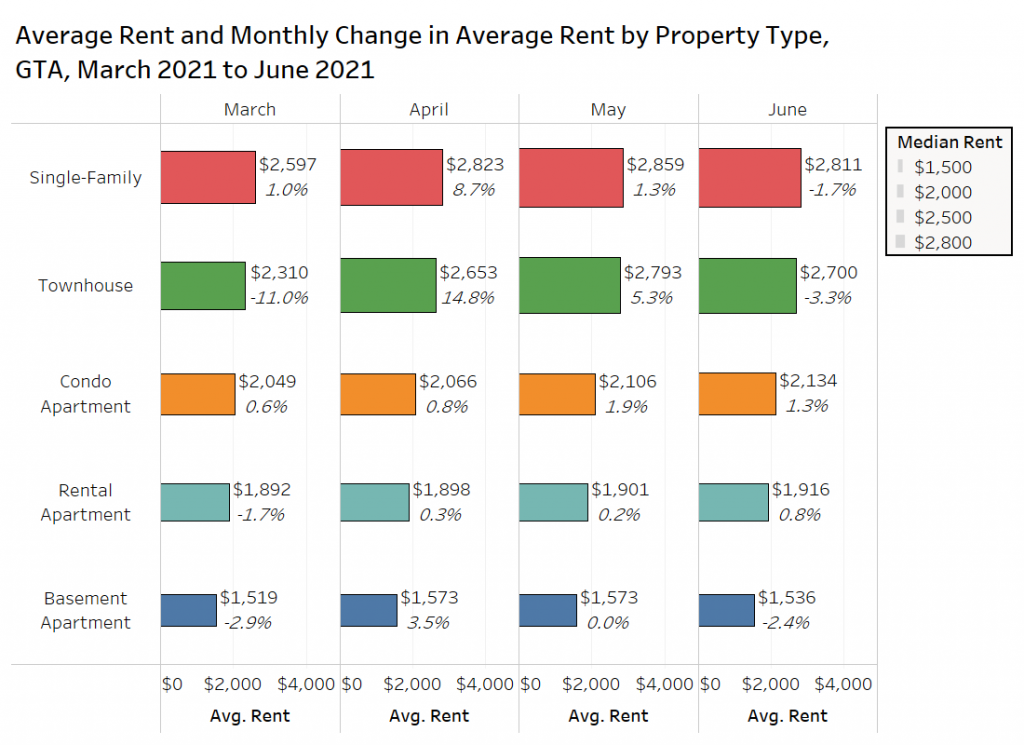
The average monthly rental rate for a basement apartment in June 2021 was $1,536, which is a monthly decrease of 2.4%.
Condo apartments have seen their average monthly rental rates steadily increase month over month since March 2021, increasing between 0.6% and 1.9%. In June 2021, the average monthly rental rate for condo apartments in the GTA was $2,134, a 1.3% increase over May 2021.
Rental apartments have remained relatively constant, experiencing lower levels of monthly change. After declining 1.7% in March 2021, rental apartments experienced three consecutive months of small (less than 1%) monthly increases in April, May, and June. The average monthly rental rate in June 2021 was $1,916.
Single-family homes have experienced a wider range of monthly changes (smaller sample size and wider size range = greater monthly volatility), ranging from a decrease of 1.7% in June 2021 to an increase of 8.7% in April 2021. In June 2021, the average monthly rental rate for a single-family home in the GTA was $2,811.
Lastly, townhomes experienced a month-over-month decrease of 3.3% in June 2021, sporting an average monthly rental rate of $2,700.
Average Rent by Bedroom Type
The figure below presents data on the average rent by bedroom type in the GTA from June 2020 to June 2021 for all property types.
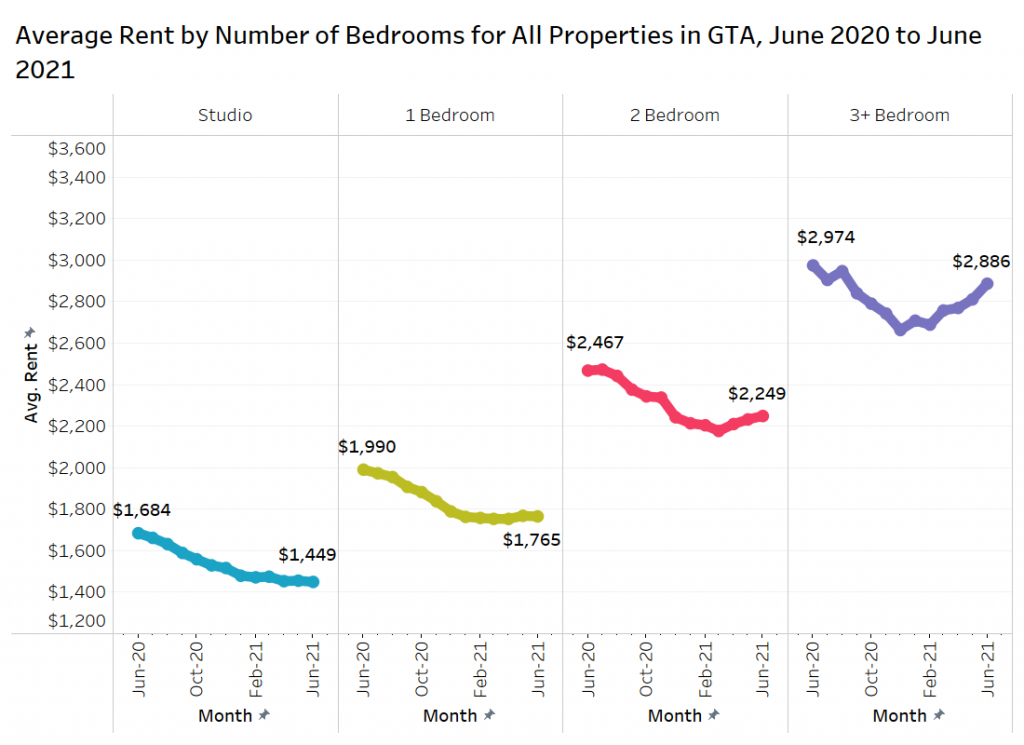
From this figure, we can see that the average monthly rental rate for studios and one-bedroom units have remained relatively constant throughout 2021, while the average monthly rental rate for two-bedroom units and units with three bedrooms or more have increased in recent months. In particular, units with three or more bedrooms have increased to within 3% of the average monthly rental rates in June 2020.
Studio units, one-bedroom units, and two-bedroom units are still down year over year, experiencing annual decreases of 14.0%, 11.3%, and 8.8% respectively. Units with three or more bedrooms are also down annually, albeit to a lesser extent.
Furnished Versus Unfurnished Rentals
The figure below presents data on the average rent and average rent per square foot for condo and rental apartments by the furnished level over the last 13 months in the GTA.
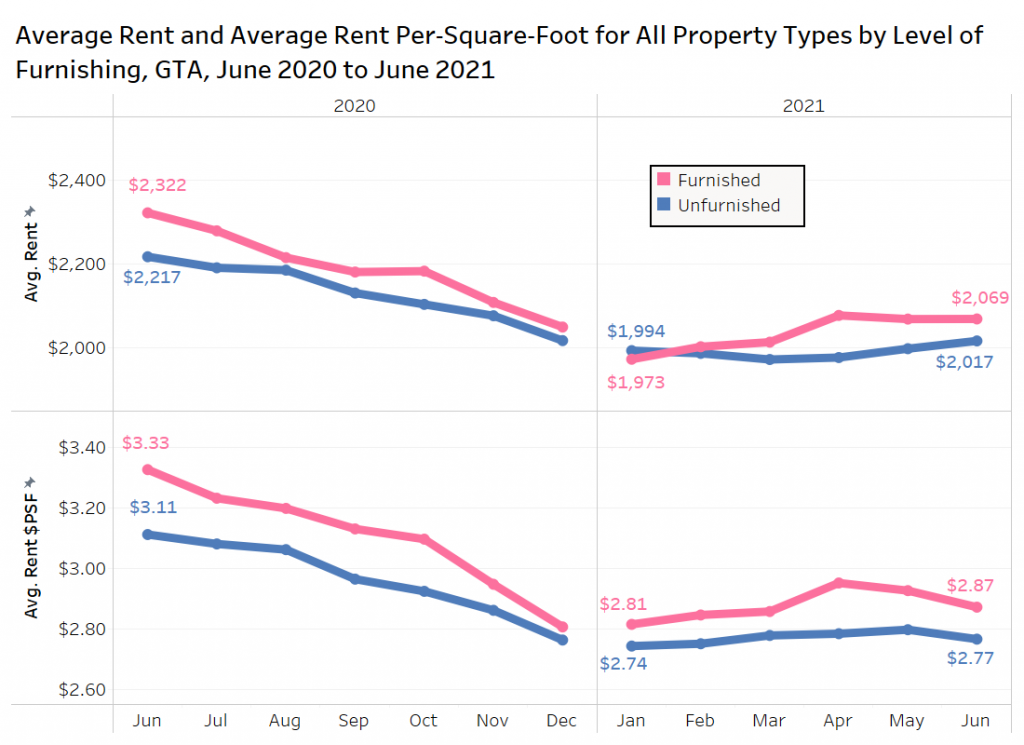
The average monthly rent for a furnished unit was 2.6% higher than the average monthly rent for an unfurnished unit in June 2021, while the average rent per square foot for a furnished unit was 3.6% higher than the average rent per square foot for an unfurnished unit.
In June 2020, the average rent for a furnished unit was 4.7% higher than that of an unfurnished unit — the furnished premium has decreased compared to a year ago. The average rent per square foot in June 2020 for a furnished unit was 7.0% higher than the average rent per square foot for an unfurnished unit, keeping in mind that the furnished units are smaller by about 50 square feet, or 6% smaller.
Average Rent in Toronto and the Rest of the GTA
The following figure shows the average rent for single-family homes, condo apartments, and rental apartments in Toronto (former city, pre-amalgamation) and in the rest of the GTA from June 2020 to June 2021, as well as the percentage difference between the average rent in the Toronto in relation to the average rent in the rest of the GTA.
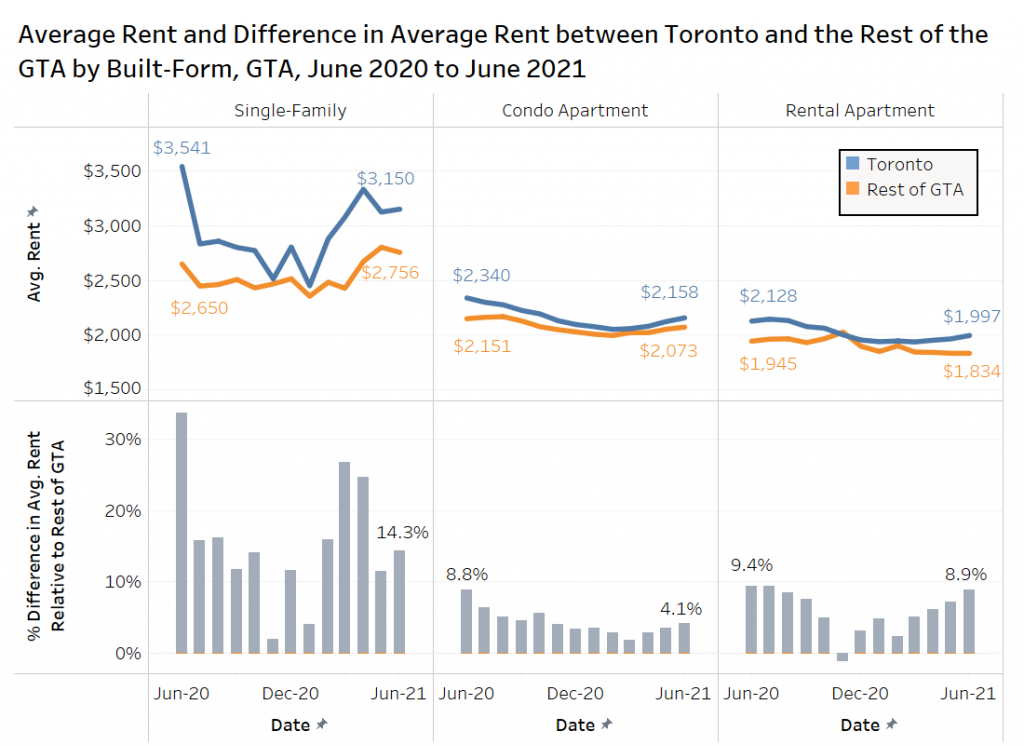
As expected, the average monthly rental rate for these three property types were consistently higher for units in Toronto compared to units in the rest of the GTA.
The difference between Toronto and the rest of the GTA was shrinking heading into 2021 (grey bars become smaller). Since then, the gap has started to gradually widen again over the last couple of months.
In June 2021, the average monthly rental rate for single-family homes was 14.3% higher in Toronto than the rest of the GTA, while condo apartments were 4.1% higher in Toronto than in the rest of the GTA. Rental apartments were 8.9% higher in Toronto compared to the rest of the GTA.
Average Rents by Municipality
The figure below presents the average rent and quarterly change in average rent for all property types in the GTA by municipality in Q2-2021.
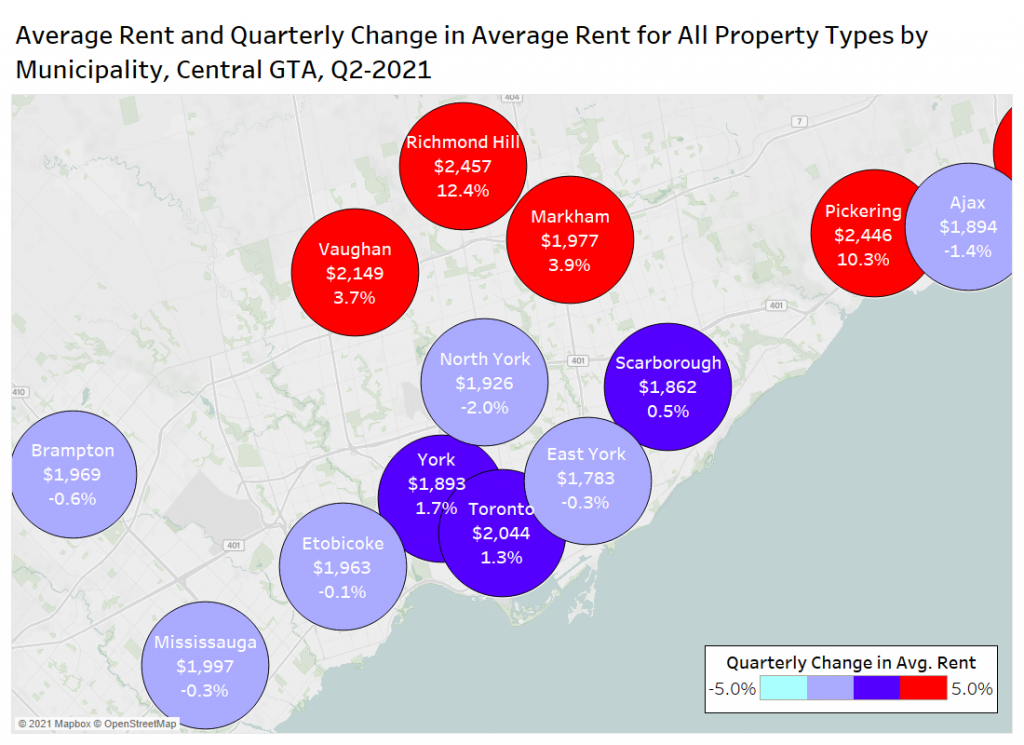
Richmond Hill experienced the largest quarterly increase in average monthly rental rates, increasing by 12.4%.
North York and Ajax are the municipalities that experienced the largest quarter-over-quarter decrease, declining by 2.0% and 1.4% respectively.
Per-Square-Foot Rents by Municipality and Rounded Unit Size
The figure below presents the average rent per square foot for condo and rental apartments for select municipalities across the GTA organized by rounded unit size in June 2021. Keep in mind that some of the sample sizes are small.
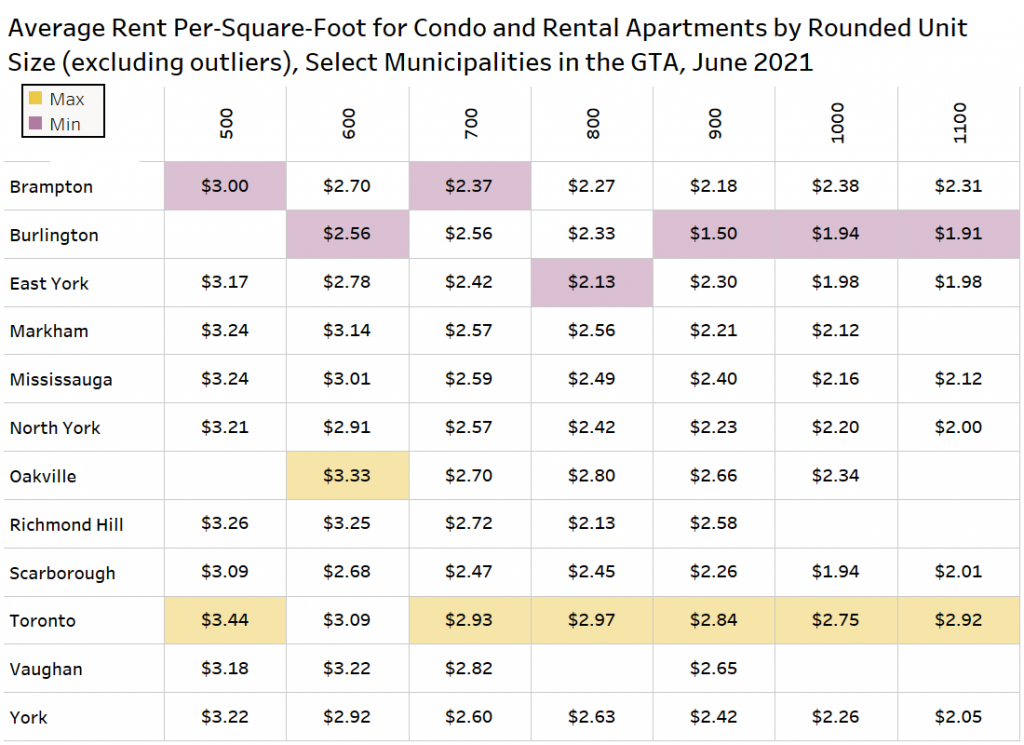
Toronto had the highest average rent per square foot for units with a rounded size between 700 square feet and 1,100 square feet, as well as for units with a rounded size of 500 square feet. Brampton had the lowest average rent per square foot for units with a rounded size of 500 square feet and 700 square feet, while Burlington had the lowest average rent per square foot for units with a rounded size of 600 square feet, and from 900 square feet to 1,100 square feet.
Average Rent by Neighbourhood
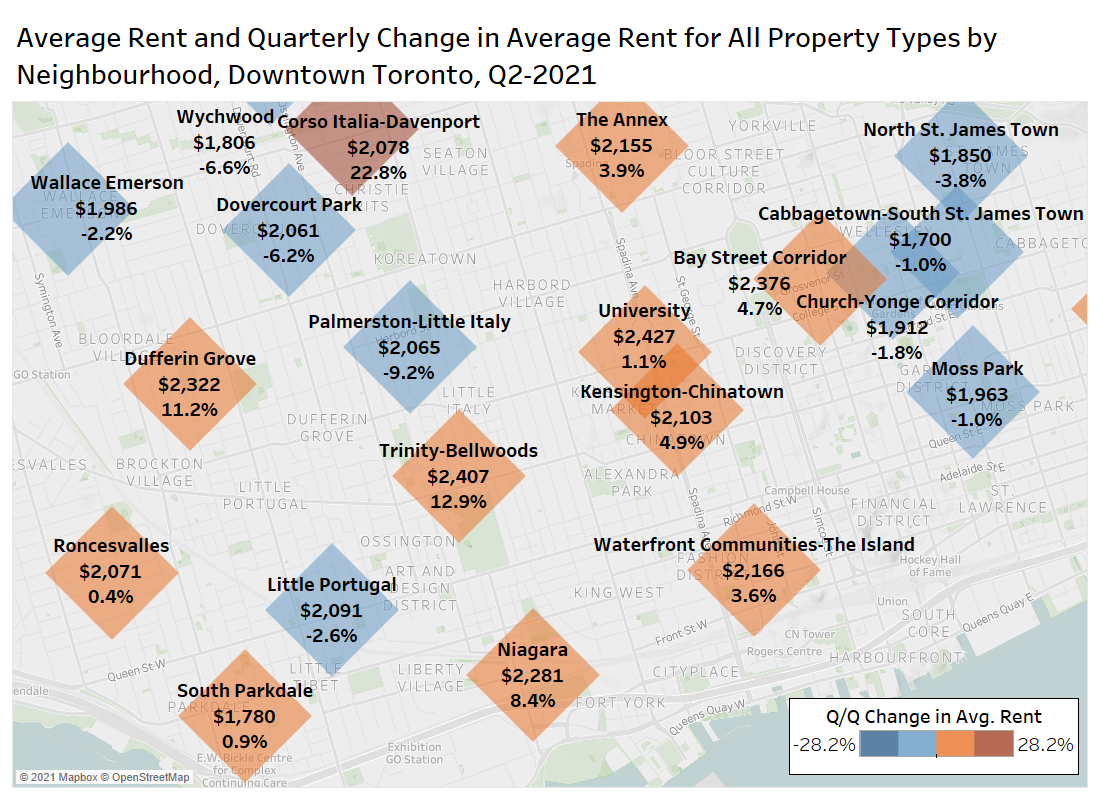
The following figure presents the average monthly rental rate and the quarterly change in average rent for all property types for various neighbourhoods in the downtown core of Toronto in Q2-2021.

The neighbourhoods that have experienced the largest increase in average monthly rental rates include Corso-Italia at 22.8%, Trinity-Bellwoods at 12.9% and Dufferin Grove at 11.2%. Some of this change could be due to a shifting composition of listings.
The most active neighbourhood in terms of listings in the second quarter of 2021 is the Waterfront Communities-The Island neighbourhood, where rents increased by 3.6% quarterly. Other high-listings areas include Niagara with an increase of 8.4% quarterly, as well as Bay Street Corridor with 4.7% quarterly growth. Interestingly, the Church-Yonge Street Corridor experienced a decline in average rent quarterly, falling 1.8% to $1,912 per month. One of the contributing factors in the decline in the-Church-Yonge Corridor is the shrinking average unit size quarter over quarter, falling from 642 square feet in Q1-2021 to 633 in Q2-2021.
Conclusion
Average rental rates are on the rise again in the GTA as vaccinations increase, case counts diminish and the region opens up. Growth in the York Region and Durham Region municipalities has picked up, as well as the central downtown area, as workers prepare to return to the office. Incentives at higher-end buildings are being reduced or eliminated as demand picks up.
Further rent growth is expected through the fall, with Bullpen Research & Consulting forecasting GTA rent growth in the double-digits in 2022.