Greater Toronto Area Rental Apartment Market
The Average Rent for All Property Types in the GTA Increased by 1.6% Annually in October 2021
The top panel in the chart below presents data on the average monthly asking rent for GTA rental listings (all property types: basement apartments, apartments, condo apartments, townhouses and other single-family homes) from January 2020 to October 2021.
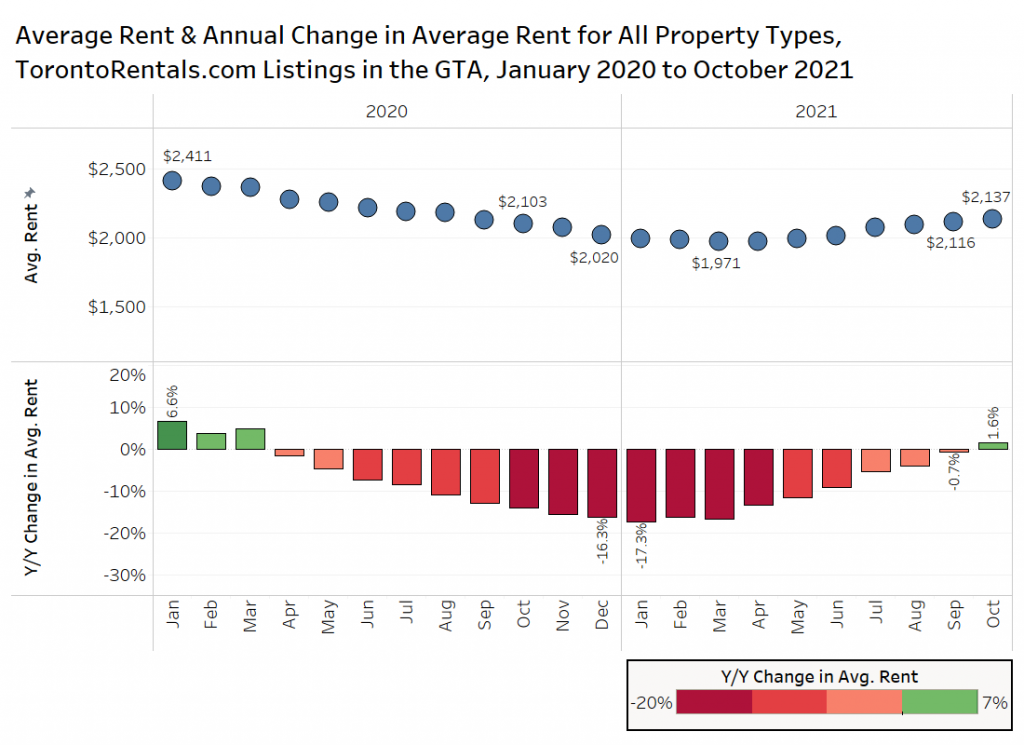
The average rent was $2,137 per month in October 2021, which represents an annual increase of 1.6% over the October 2020 average rent of $2,103 per month. October 2021 is the first month to experience an annual increase in average monthly rent since March 2020. The average monthly rental rates had steadily declined throughout 2020 and into the early part of this year, hitting a local low of $1,971 per month in March 2021 before beginning to slowly climb.
Average Rental Rates by Bedroom Type
The chart below presents data on the average rent by bedroom type in the GTA from January 2021 to October 2021 for all property types. Six-bedroom units have been removed from the chart, as the small sample sizes lead to monthly volatility.
Average Asking Rents for One-Bedroom Units Down 0.7% Annually, Two-Bedroom Units Down 0.3% Annually
The start of 2021 saw studio units, one-bedroom, two-bedroom, and three-bedroom units experience significant year-over-year declines in average rental rates (-14% to -18% year over year). Four- and five-bedroom units did not experience the same levels of decline. Four-bedroom units saw annual increases in average rental rates every month in 2021. As mentioned several times in previous reports, tenants have sought out larger units to rent while working from home.
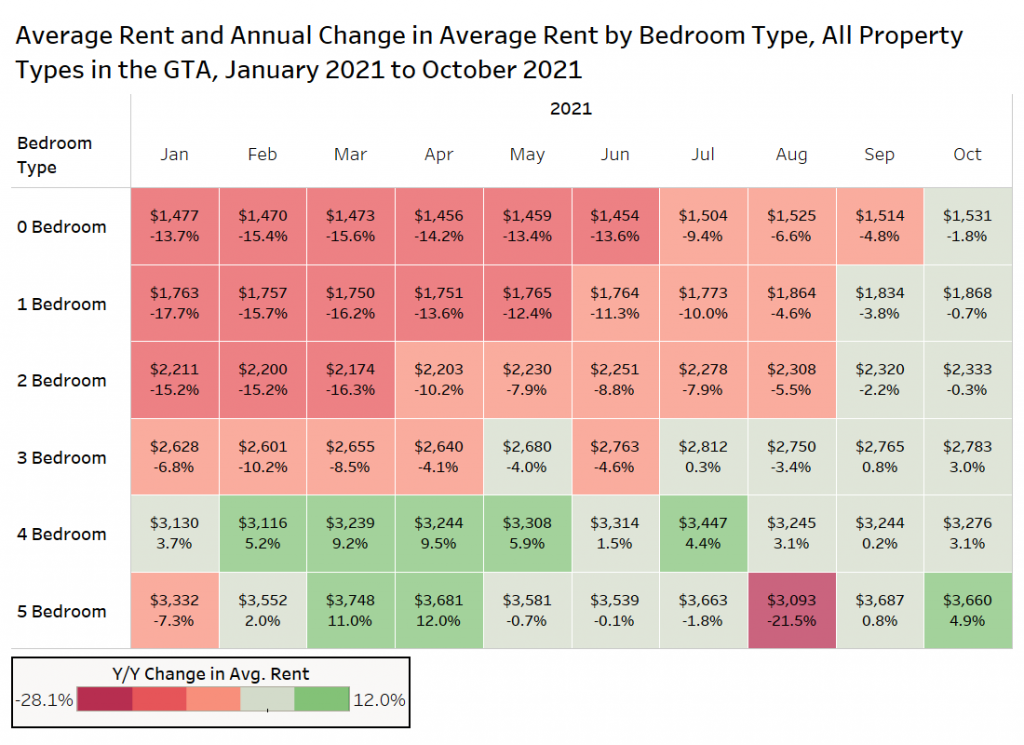
The yearly declines have slowed in recent months. Data for October 2021 shows that studio units have experienced an annual decline of 1.8%, one-bedroom units have experienced an annual decline of 0.7%, and two-bedroom units have experienced an annual decline of 0.3% in October.
However, when comparing October figures to March of this year, prospective tenants seeking a studio unit will be looking at spending $60 more on rent; tenants looking for a one-bedroom would be looking at spending about $120 more than they might have in March; while two-bedroom units are nearly $160 more expensive per month than seven months earlier.
Average Rental Rates by Property Type
GTA Condo Rental Rates are Up 11.8% Year Over Year
The figure below presents GTA data on the average rent for single-family homes, condominium apartments and rental apartments over the past three years via Rentals.ca listings data.
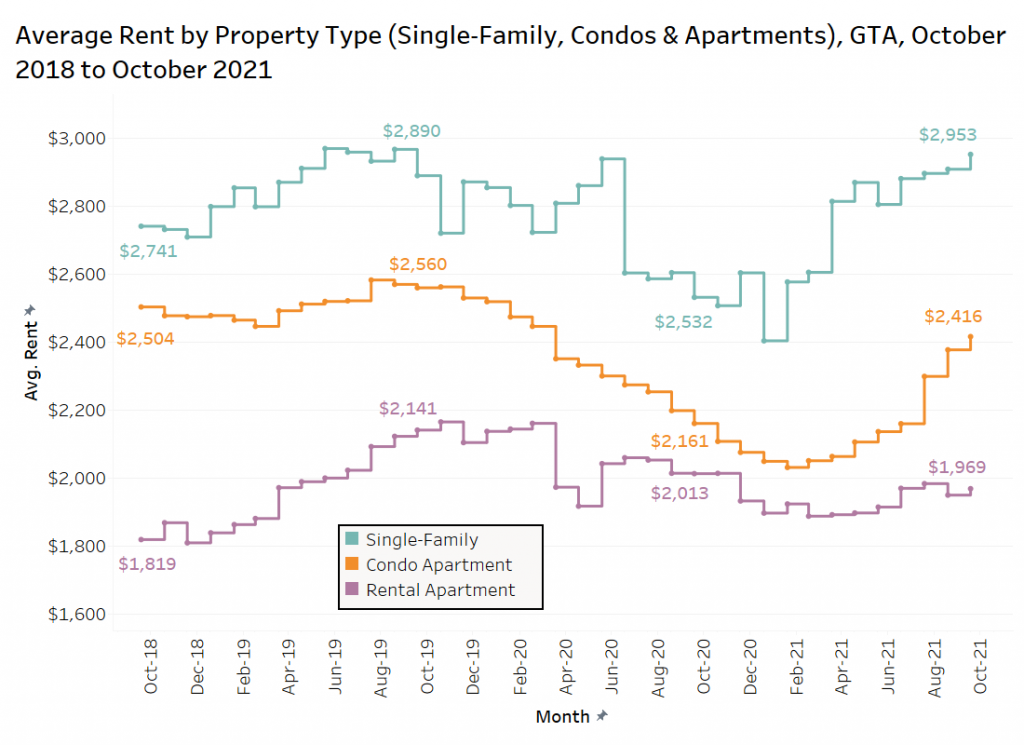
The average rent for condo apartments has risen 11.8% year over year, moving from $2,161 per month in October 2020 to $2,416 per month in October 2021. This is a relatively swift increase after the average rent steadily declined throughout the latter half of 2019 and all of 2020. However, the average investor-held condo for rent is still $145 per month cheaper than October 2019.
Single-family homes also experienced a sharp increase in average rental rates of over $400 in one year, moving from $2,532 per month in October 2020 up to $2,953 per month in October 2021 — a year-over-year increase of 16.6%. Similar to condo apartments, the average rental rates also declined throughout most of 2019 and 2020 (single-family home data is more volatile due to the smaller sample size and the wide range of single-family housing for rent). The recovery has been stronger however, as the average rental rate in October 2021 has surpassed the peak levels of 2019.
Apartments have yet to experience the same levels of recovery as condo and single-family homes. Year over year, the average rental rate for apartments has declined 2.2% to $1,969 per month. However, it should be noted that incentives for apartments were high last year at this time, and many of those incentives have been removed. There were a lot of vacant units in higher-rent areas like Toronto which have been leased, leaving a higher share of the listings in lower-rent areas. The composition of the listings is important when comparing a time-series of data.
Average Rent Per Square Foot by Bedroom Type
The figure below presents data on the average rent per square foot for condo and rental apartments in the GTA from October 2019 to October 2021 by bedroom type.
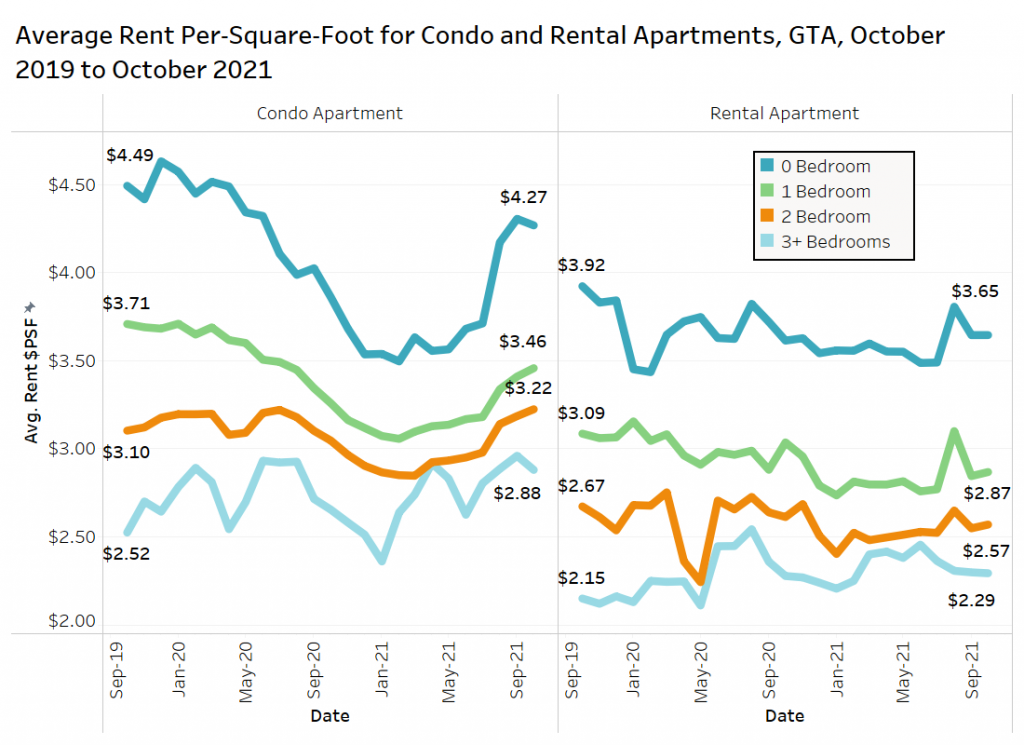
The average rent per square foot for condo apartments experienced some significant declines throughout 2020 before bouncing back in 2021. The most noteworthy recoveries are the studio units, which have seen their average rent increase to $4.27 per square foot (psf), up 10.6% annually after falling by 14% in the 12 months before.
Overall, the average rent per square foot for rental apartments has been fairly flat over the past nine months, after slowly declining from the fall of 2019 to the start of winter last year.
For condominium apartments, rents per square foot were higher in October 2021 than October 2019 for two-bedroom units and three-bedroom and larger units, and rents per square foot for rental apartments on the three-bedroom and larger units have surpassed the 2019 peak levels.
Average Rents by Municipality
Average Rent in the Former City of Toronto is Up 3.9% Annually
The chart below looks at the average rent for all property types in select municipalities in Ontario in October 2021 (Toronto is broken up into its former municipalities, prior to amalgamation).
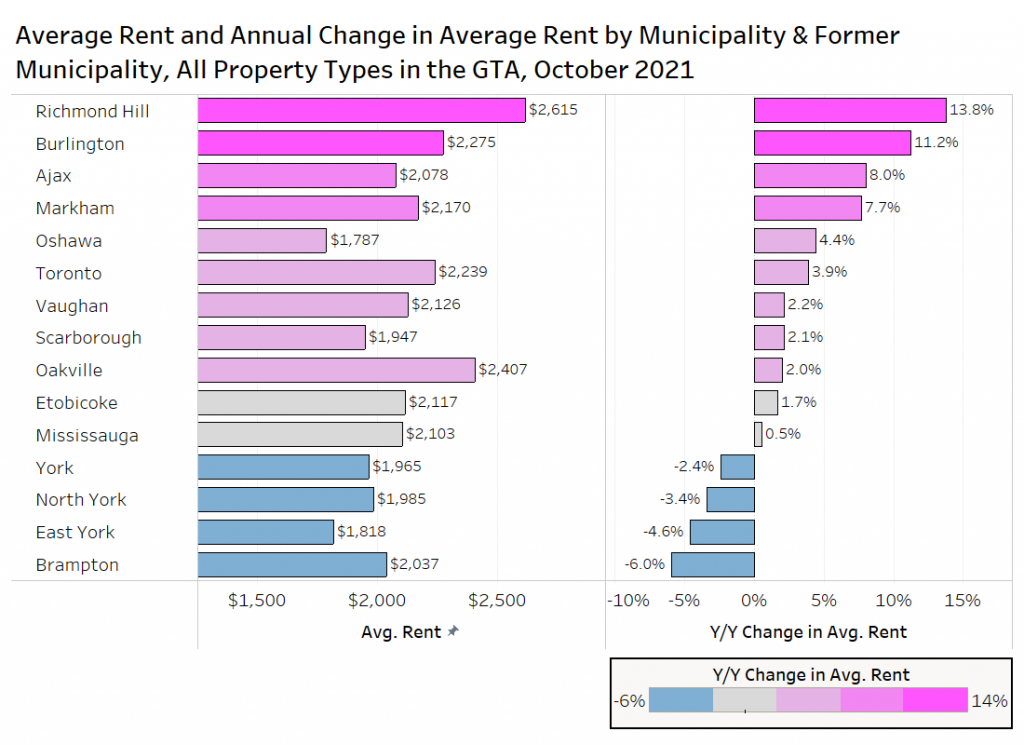
Many of the suburban communities have experienced significant increases in their average rental rates. Richmond Hill leads the way, with an annual increase of 13.8%, followed by Burlington at 11.2%. Ajax experienced an 8.0% annual increase, while Markham experienced an annual increase of 7.7%.
Toronto experienced an annual increase of 3.9%.
A handful of areas closer to the GTA core experienced annual declines in average monthly rental rates. York declined 2.4%, North York declined 3.4%, and East York declined 4.6%. The municipality that experienced the largest annual decline in monthly rental rate was Brampton at 6%.
Condo and Rental Apartment Rates for Select Areas
The chart below looks at four municipalities and former municipalities in the GTA – Etobicoke, Mississauga, North York and old Toronto. The average rent (coloured vertical bars) and median rent (black horizontal bars) are shown for October 2020 and October 2021, with the average rent and annual change in average rent marked above the bars.
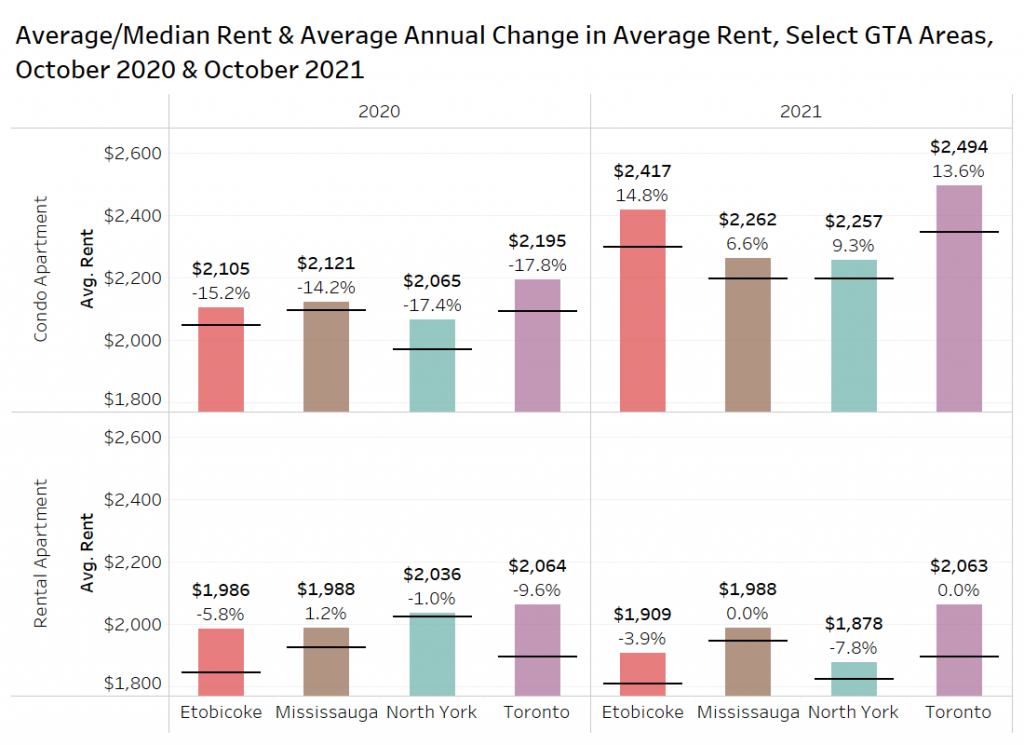
In October 2021, condo apartments in Etobicoke experienced the highest annual increase in monthly rental rates at 14.8%, followed by Toronto at 13.6%. Last year at this time, condo rental rates were down by 15.2% in Etobicoke and 17.7% in Toronto.
North York experienced the greatest annual decline in monthly rental rate for rental apartments –down 7.8% annually. Etobicoke apartment rents were down about 4% annually, while Mississauga and Toronto are unchanged year over year.
Condo and Rental Apartment Rent Per Square Foot
The following figure presents the average rents per square foot for Downtown Toronto, Etobicoke, North York, and Mississauga from October 2020 to October 2021. It should be noted that not all properties listed on TorontoRentals.com have their unit sizes available, so this data is based on a smaller sample size, and is a straight average, not a weighted average.
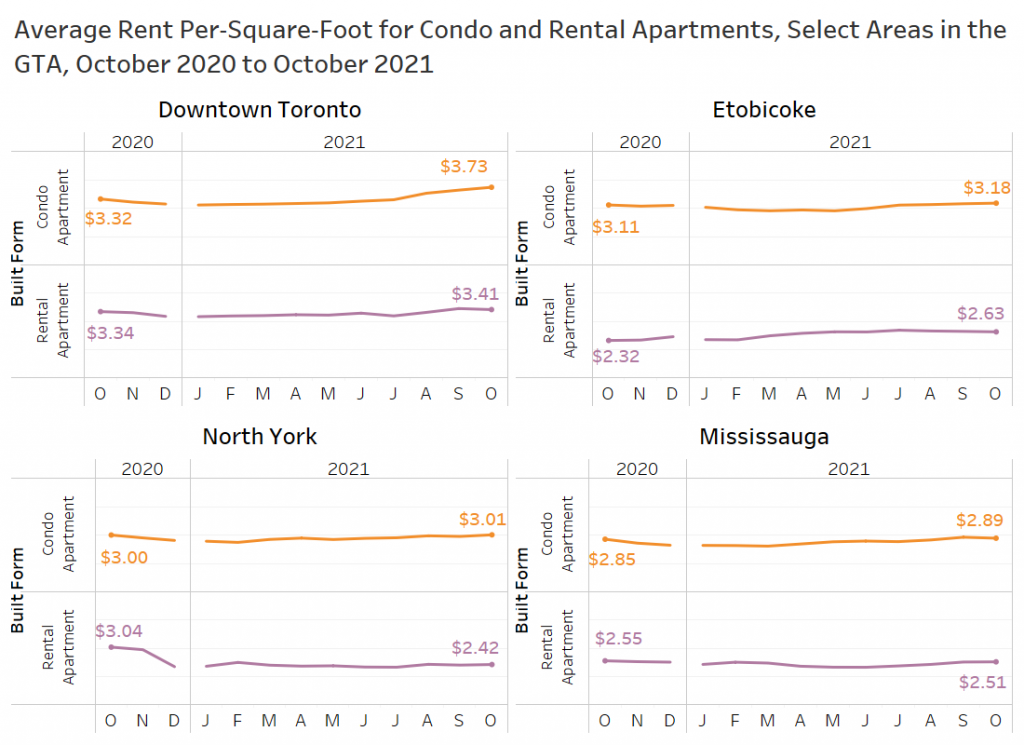
In downtown Toronto, the average rent per square foot has increased annually for both condo apartments and rental apartments. Condo apartments have seen their average rent per square foot move from $3.32 psf in October 2020 up to $3.73 psf in October 2021, while rental apartments have seen their average rent per square foot move from $3.34 psf in October 2021 up to $3.41 psf in October 2021.
The average rent per square foot for condo apartments in Etobicoke has also increased, moving from $3.11 psf in October 2020 up to $3.18 psf in October 2021. Rental apartments have moved from $2.32 psf in October 2020 to $2.63 psf in October 2021.
In North York, the average rent per square foot has not experienced any significant change year over year, moving from $3 psf in October 2020 to $3.01 psf in October 2021. Rental apartments have declined however, moving from $3.04 psf in October 2020 down to $2.42 psf in October 2021. This is an annual decline of 20%, however, a new rental project started leasing last fall with a significant inventory of new product, skewing last year’s data.
Condo apartments in Mississauga have seen average rent per square foot move from $2.85 psf in October 2020 up to $2.89 psf in October 2021, while rental apartments have moved from $2.55 psf in October 2020 down to $2.51 psf in October 2021 (changes of less than 2%).
Year-Over-Year Change in Average Rent by Postal Code
The figure below shows the annual change in average rent for postal codes across Toronto in October 2021 (includes areas with 20 or more listings only).
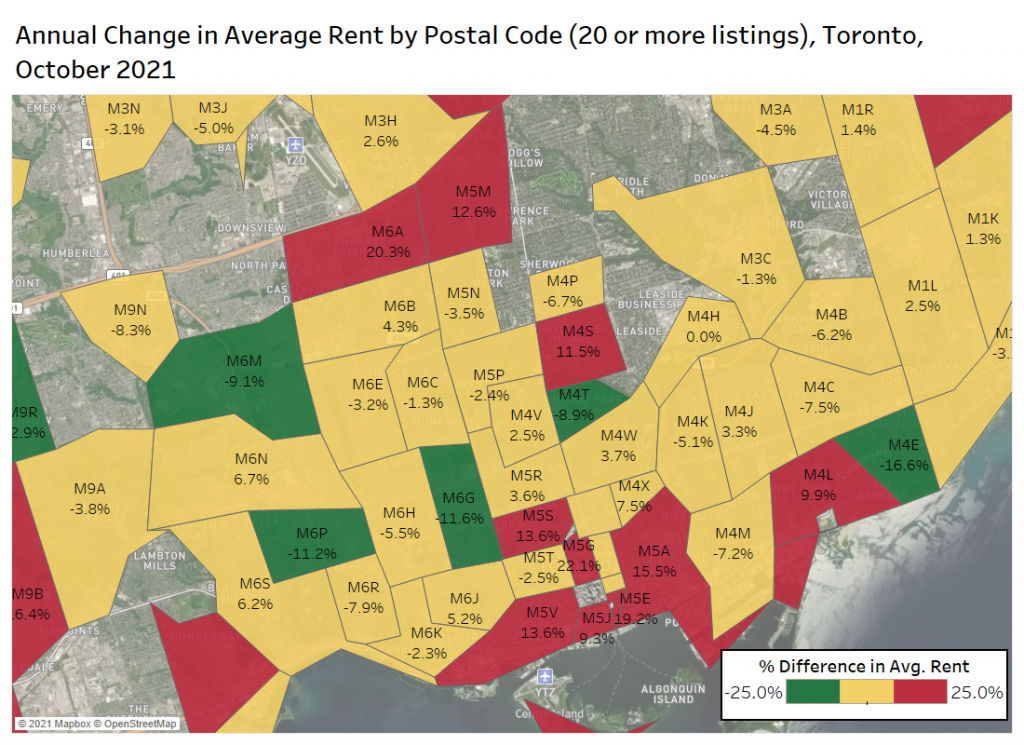
The main downtown postal codes have all experienced significant annual rent growth, with two of the most active areas, M5V and M5A seeing average rents increase by 13.6% annually and 15.5% annually.
Unit Sizes in Select Neighbourhoods
The following figure presents the distribution of unit sizes for condo and rental apartments in select neighborhoods in the GTA in October 2021. This shows units from 200 square feet to 1,000 square feet only.
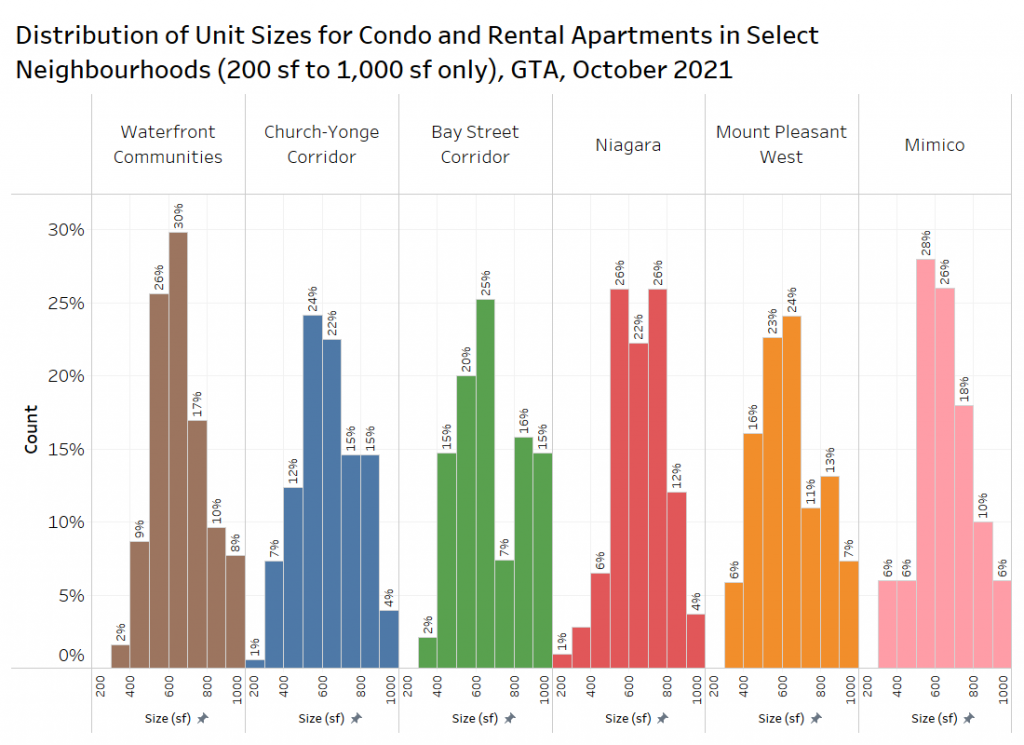
The most active area is the Waterfront Communities, where 30% of the units are between 600 square feet and 700 square feet.
The area that has the highest share of larger units is the Bay Street Corridor, where 15% of the listings in October were from 900 square feet to 1,000 square feet.
Rent by Project
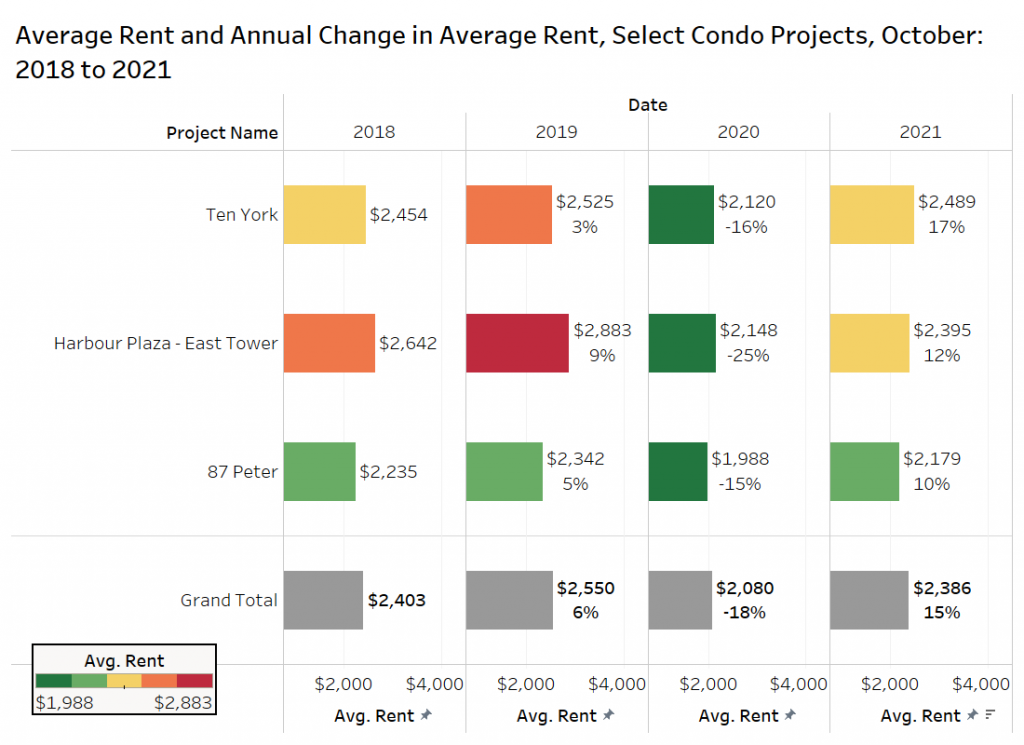
The chart below follows the average rental rate in October over the past four years, with the annual change in rental rate for the last three periods. Three of the most active condo markets for rental activity were chosen.
The data shows the roller coaster ride of rents since 2019, decreasing annually by 18% in 2020 and then increasing annually by 15% in 2021 year to date. Ten York declined 16% in 2020, which was followed by an annual increase of 17% in 2021. The average rent at Harbour Plaza – East Tower declined a whopping 25% in 2020 before increasing 12% in 2021. Lastly, 87 Peter decreased 15% in 2020 before increasing 10% in 2021.
Conclusion
For the first time in over a year, the average monthly rental rates have experienced a positive year-over-year change, increasing by 1.6%. Throughout most of 2021, the annual declines in average rent have slowly diminished in size heading into the fourth quarter of the year.
Larger units continue to be popular with tenants. Units with three or more bedrooms generally post higher annual changes in average monthly rental rates. Single-family homes have also recovered strongly, increasing by 16.6% year over year.
The narrative that tenants are fleeing the downtown core for larger units in suburban areas is still showing up in the data, as the average rents in Richmond Hill, Burlington, Ajax, and Markham all experienced annual increases over 7% in October. While Toronto also experienced a positive change in average rental rates, York, East York, and North York (all areas that are closer to Toronto) experienced negative year-over-year changes in average rental rates.
The average rent and average rent per square foot for rental apartments did not experience the same levels of decline as condo apartments, and have stayed steady throughout the pandemic. Condo apartments, after a long period of annual declines, are on the path to recovery as average rental rates look to move higher than the early 2020 levels. Moving forward, look for these trends to continue as the economy recovers and returns to normal.
Disclaimer
The information, statements, statistics and commentary contained within this report that was prepared by Bullpen Research & Consulting Inc. (“Bullpen”) utilized data and information from various secondary sources, as well as various discussions with industry participants. Bullpen based this report on information received or obtained, on the basis that such information is correct. Bullpen does not warrant the accuracy or completeness of the information provided or any assumptions or conclusions made by the parties that provided the information.
While Bullpen made every effort to present accurate and reliable information in all the material as provided, Bullpen does not endorse, approve, or certify such information, nor does it guarantee the accuracy, completeness, efficacy, timeliness, or correct sequencing of such information. Use of such information is voluntary, and reliance on the information should only be undertaken after an independent review. Reference herein to any specific information, material or otherwise provided, does not constitute or imply endorsement, recommendation, or favouring by Bullpen.
Bullpen assumes no responsibility, financial or otherwise, for consequences resulting from the use of the material or information herein, or in any respect for the content of such information, including (but not limited to) errors or omissions, the accuracy or reasonableness of factual or scientific assumptions, studies or conclusions, research, the defamatory nature of statements, ownership of copyright or other intellectual property rights, and the violation of property, privacy, or personal rights of others. Bullpen is not responsible for, and expressly disclaims all liability for, damages and/or losses and/or risks, personal, professional, commercial or of any kind arising out of use, reference to, or reliance on such information. No guarantees or warranties, including (but not limited to) any express or implied warranties of merchantability or fitness for a particular use or purpose, are made by Bullpen with respect to such material and/or information. Bullpen and any sub-consultant contracted for this report make no warranty or representation regarding the results or performance that may be obtained from the use of the material or information as provided and/or regarding the accuracy or reliability of any information, or that Bullpen and the sub-consultant’s information or material will meet any user’s requirements, be uninterrupted, timely, secure or error-free. Bullpen reserves the right to change any information or material without notice or warranty.
Ben Myers – President – Bullpen Research & Consulting Inc.
674 Kingston Rd, Suite 201, Toronto, ON – www.bullpenconsulting.ca – 416 716 2096 – [email protected]