Greater Toronto Area Rental Market
The following chart looks at the average asking rent data from TorontoRentals.com listings in the Greater Toronto Area (GTA).
Monthly Asking Rent and Monthly Change in Rent for All Property Types
The chart below looks at the average rent for all property types by month since the start of 2020 (blue line – left axis), with the monthly change in average rent represented by the orange bars.
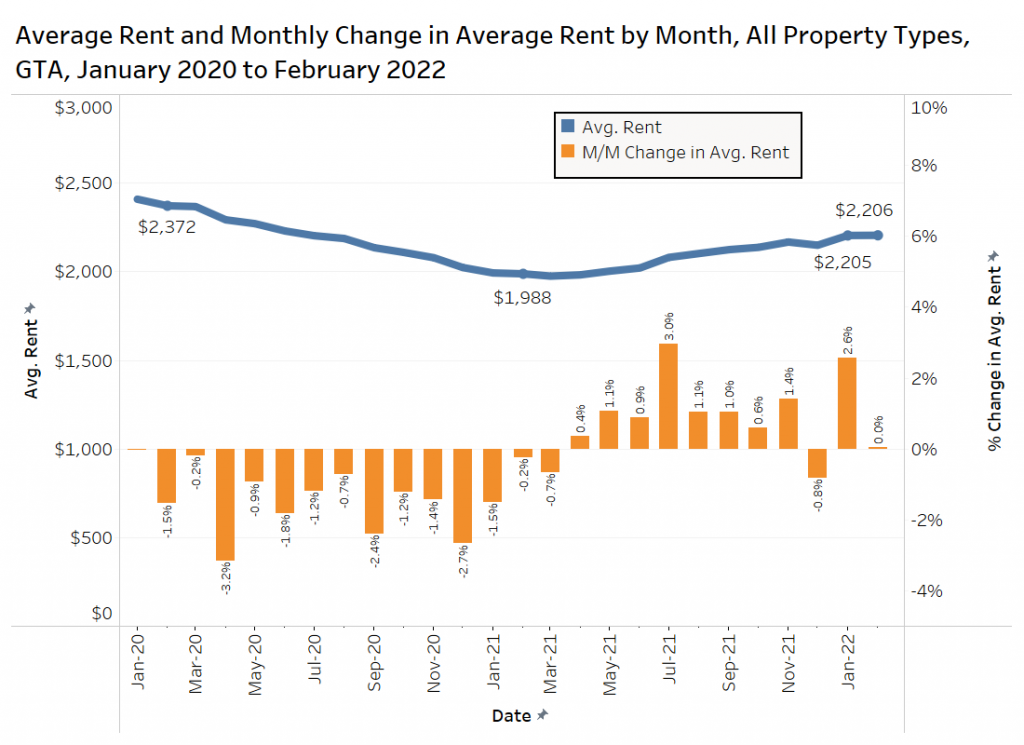
The average monthly rental rate declined every month from January 2020 to March 2021. Since April 2021, the average rent has increased month over month for 10 of the last 11 months as the rental market begins to recover from the pandemic-related shake-up.
The February 2022 rent of $2,206 on average was up just $1 from January 2022’s $2,205 per month, but up 11% annually from February 2021 ($1,988 per month).
Quarterly Rent Levels by Property Type
The figure below presents GTA data on the average rent and average rent per-square-foot for single-family homes, condominium apartments, and rental apartments by quarter from the start of 2021 to the end of February 2022 via TorontoRentals.com listings data.
Condo apartments in Q1-2022 (January-February only) had an average monthly rental rate of $2,484 per month, representing an annual change in average monthly rental rate of nearly 21%. Condo apartments also had an average rent per-square-foot of $3.43.
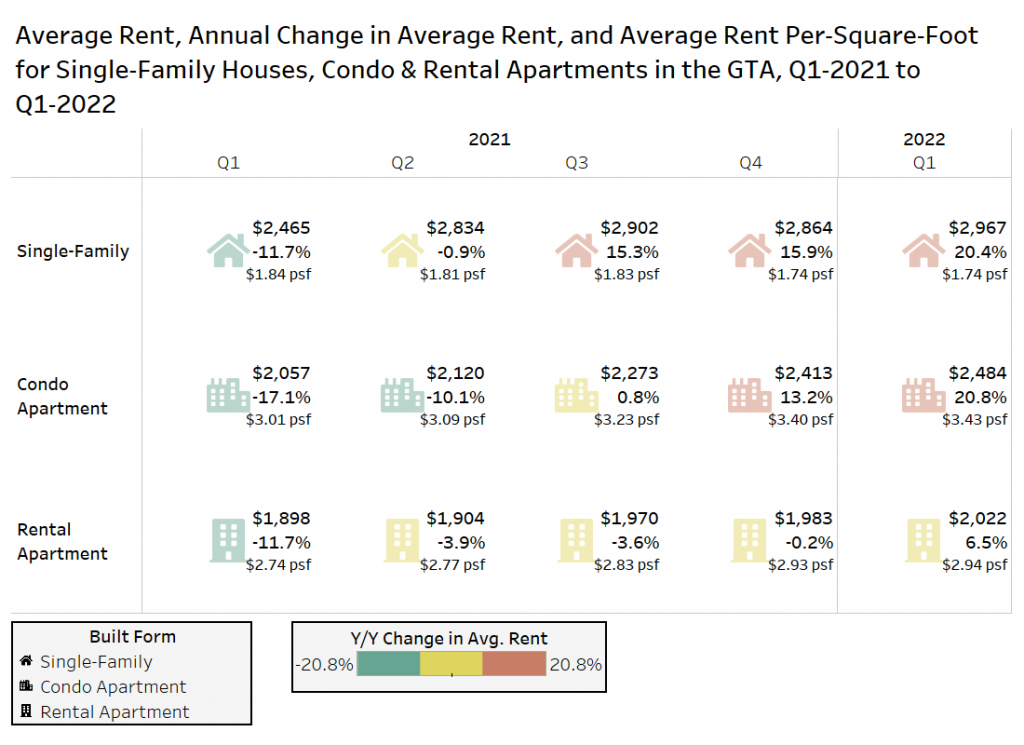
Rental apartments had an average monthly rental rate of $2,022 per month, which is an annual increase of 7%. Rental apartments had an average rent per-square-foot of $2.94.
Single-family homes had an average monthly rental rate of $2,967 per month, representing a year-over-year increase of 20%. Single-family homes also had an average rent per-square-foot of $1.74.
Monthly Asking Rent and Monthly Change in Rent for Condominium and Rental Apartments
The next chart looks at condominium and rental apartments only, tracking the average monthly rent versus the month-over-month change in that average rent. This chart only looks at the data between January 2020 and February 2022.
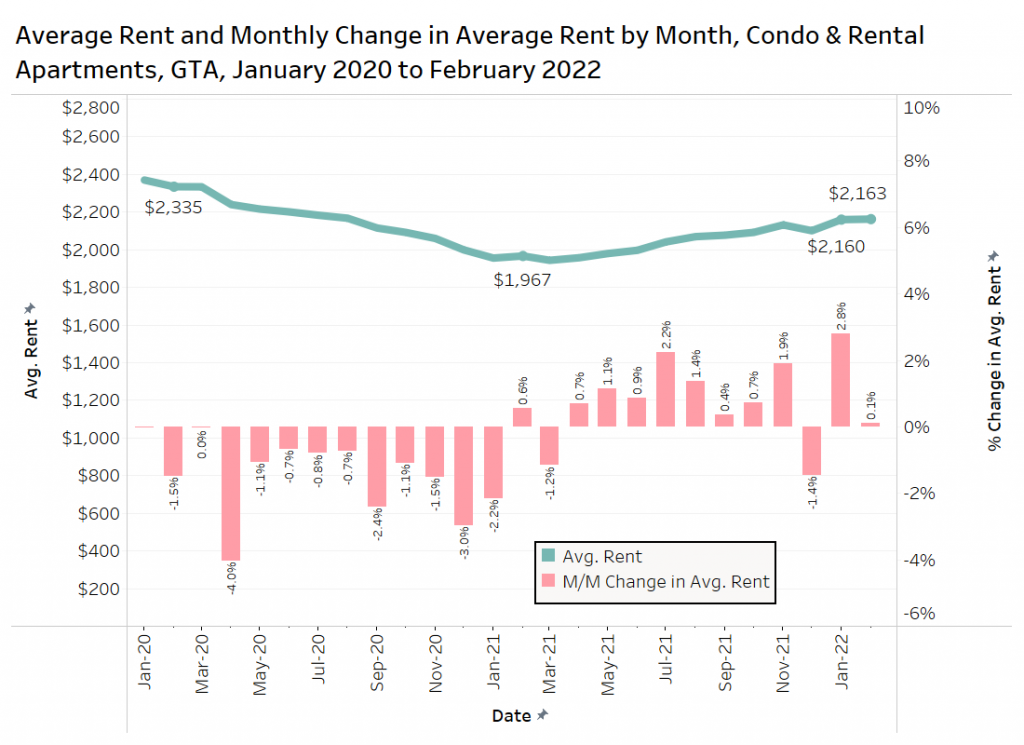
The average rent for condominium apartments and rental apartments in the GTA in February 2020 was $2,335 per month and average rents declined every month for the following year. The monthly rental rate hit $1,967 per month in February 2021. Since then, the monthly rental rates have continued to trend up, sitting at $2,163 per month in February 2022 a 0.1% monthly increase and a 10% annual rise.
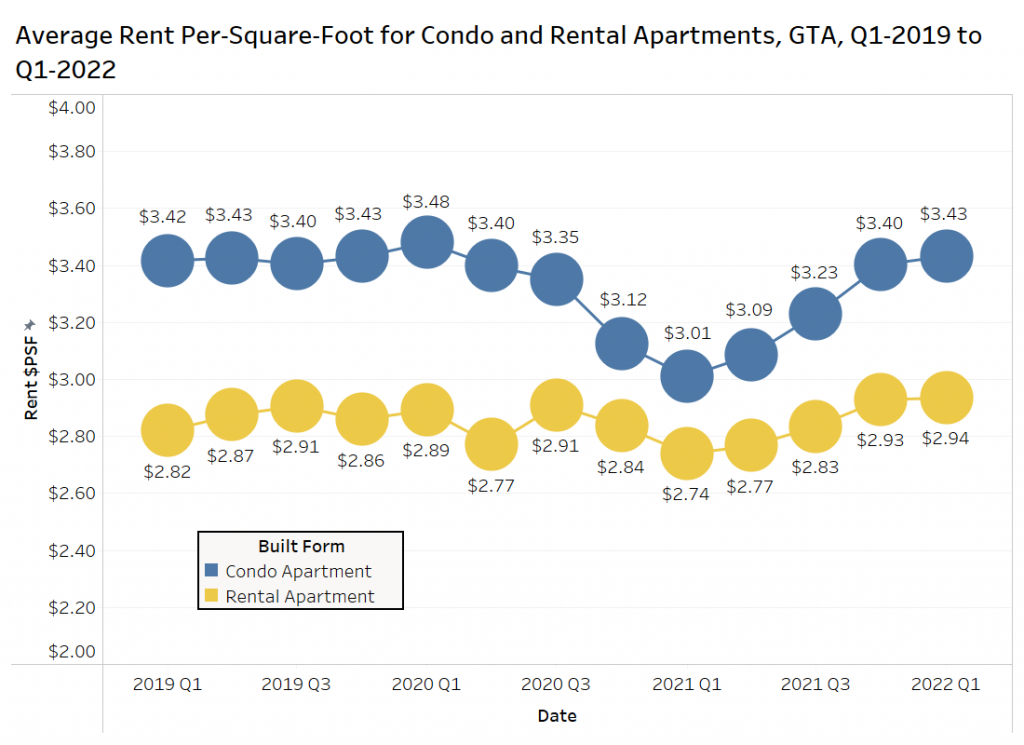
Average Rent Per-Square-Foot by Apartment Tenure
The chart below plots the average rent per-square-foot for condominium and rental apartments in the GTA from Q1-2019 to Q1-2022. Please note that not all units listed on TorontoRentals.com have their suite size listed, so this data is a straight average of the units where data is available. The results likely skew high, as newer buildings are more likely to have their unit sizes known to landlords and/or owners.
The average rent per-square-foot for condo apartments has steadily increased throughout 2021, moving from $3.01 in Q1-2021 up to $3.43 in Q1-2022 (+14% Y/Y). The market has nearly returned to the pre-pandemic high of $3.48 per square foot in the first quarter of 2020.
The average rent per-square-foot for rental apartments has also steadily increased throughout 2021 (albeit at a slightly lesser pace), moving from $2.74 in Q1-2021 up to $2.94 in Q1-2022, an annual increase of 7%.
Average Rent by Quarter and Bedroom Type by Apartment Tenure
In the figure below, the average rent for condominium and rental apartments in the GTA from February 2021 to February 2022 is shown, with the data broken out by bedroom type.
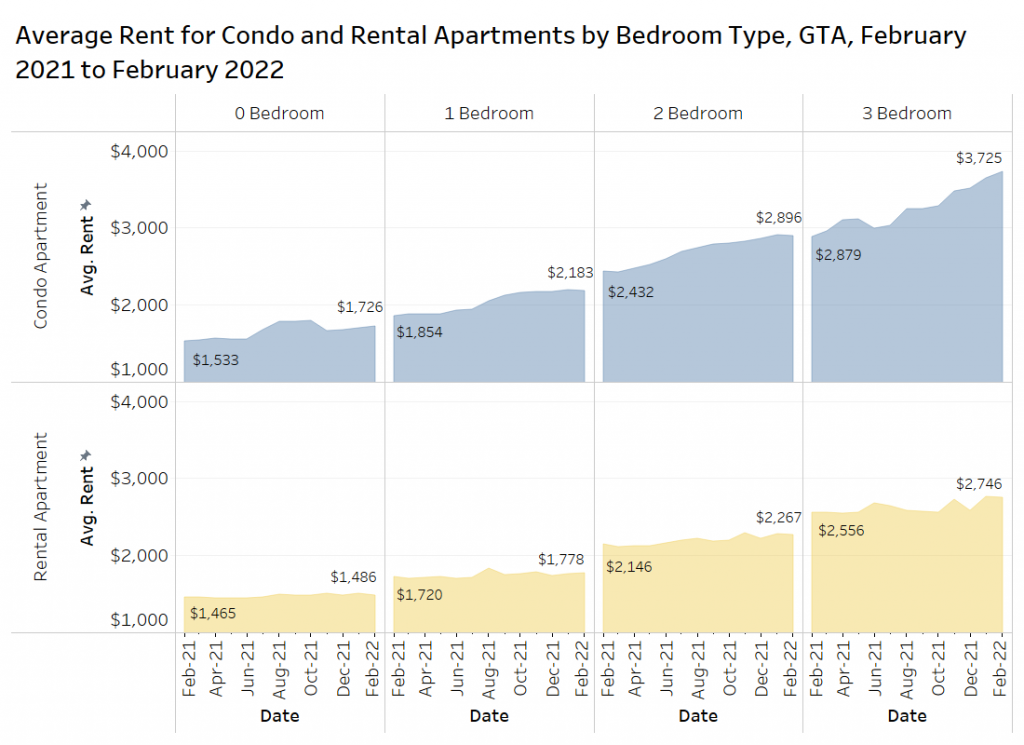
Across all bedroom types, both condo and rental apartments have increased annually.
Three-bedroom condo apartments experienced the sharpest annual increase in average monthly rental rates, moving from $2,879 per month in February 2021 to $3,725 per month in February 2022 (a year-over-year increase of 29%). One-bedroom condos increased by 18% to $2,183 per month, while two-bedroom condos increased by 19% to $2,896 per month.
In general, rental apartments experienced more modest annual increases in average monthly rental rates. One-bedroom apartments increased by 3.4% to $1,778 per month, while two-bedroom apartments rose 5.6% to $2,267 per month.
Keep in mind that there are several buildings offering rental incentives in 2021, and those incentives are not netted out of the average rental rates. Secondly, these rental rates presented here are asking rents, and it is likely that an investor-owner of a condo is more likely to negotiate a lower rent than an institutional apartment owner.
Average Rent and Annual Change in Average Rent by Municipality
The map below shows the average rent, annual change in average rent and average rent per-square-foot for condominium and rental apartments by municipality (and former municipality) in the GTA in Q1-2022 (January-February only).
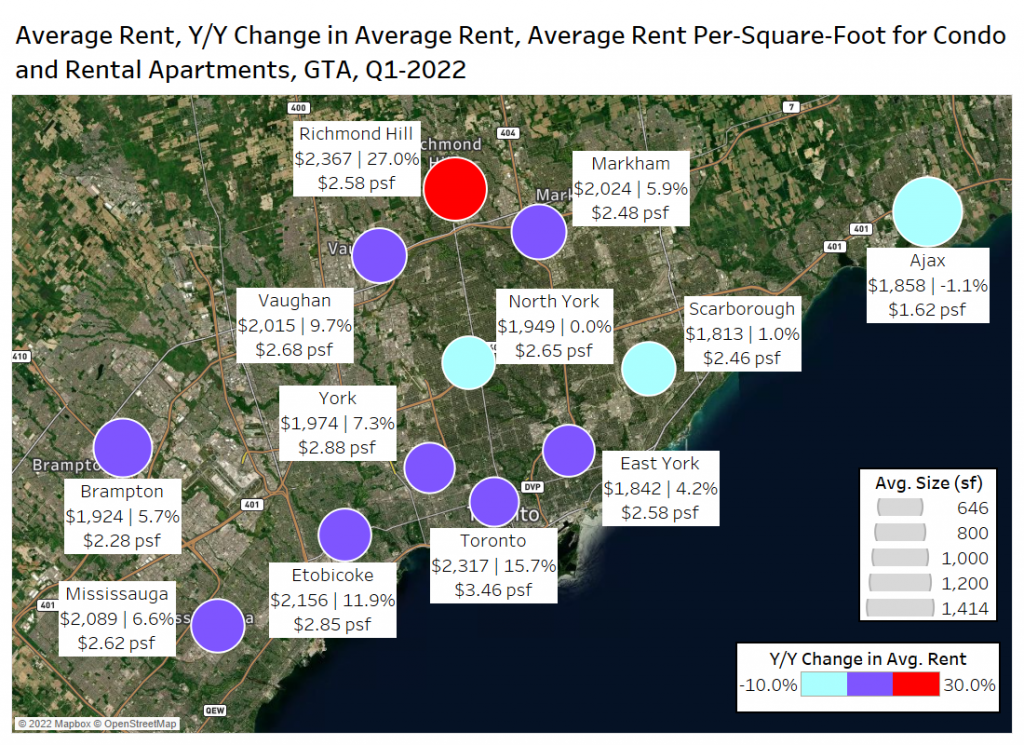
The average rent in Toronto has increased by 15.7% annually to $2,317 per month, with an average rent per-square-foot of $3.46. Richmond Hill has also experienced significant annual increases in rental rates, increasing by 27% year over year to $2,367 per month with an average rent per-square-foot of $2.58.
Ajax is one of the few municipalities in the GTA (the only one selected in this map) that experienced an annual decline in average monthly rental rates, declining 1.1% year over year to $1,858 per month with an average rent per-square-foot of $1.62. However, there are few condo apartments for rent in Ajax, and the vacancy rate is low for rental apartments, so the sample size of listings might not be representative of overall market conditions.
GTA Listing Locations
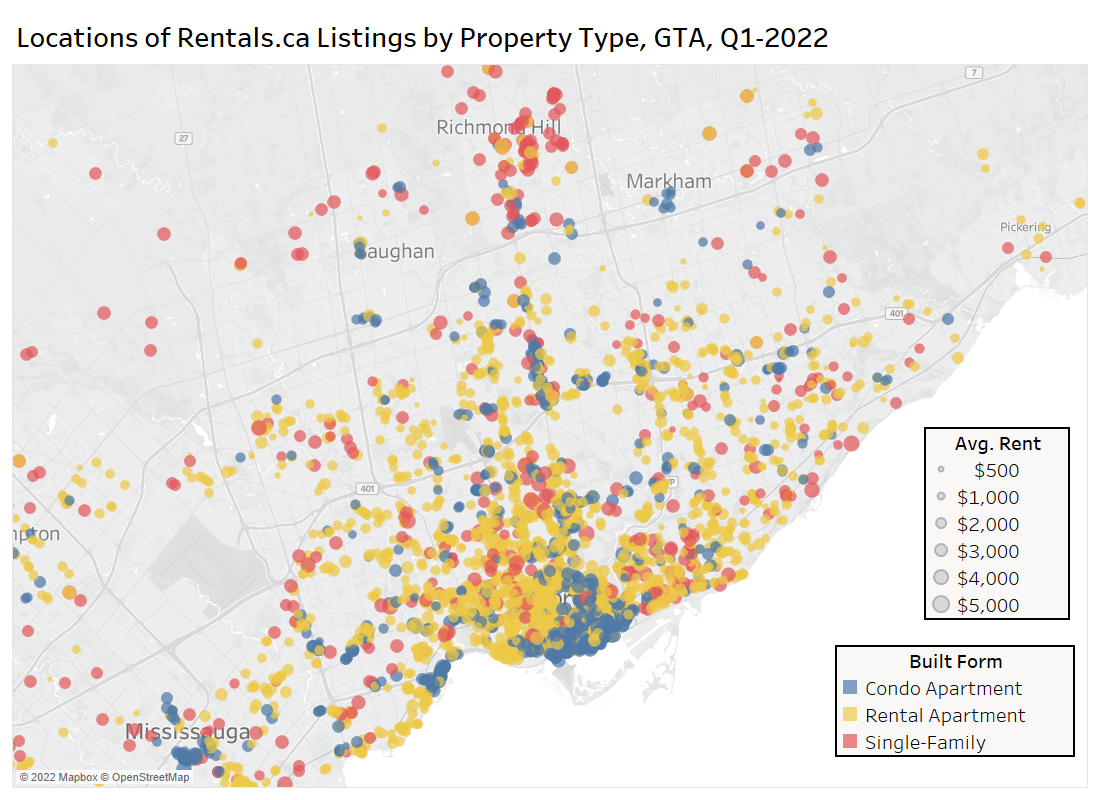
The map below shows the location of the TorontoRentals.com listings reviewed in this quarter (January-February only), with the colour corresponding to the property type (singles, condos, and rental apartments only), and the size of the markers reflecting the average rent of that location.

In Q1-2022, condo apartments appear to be concentrated in the downtown Toronto area, as the blue markers are generally clustered in the downtown core.
Rental apartments appear to be dispersed throughout the southern GTA, with more limited activity in York Region.
Single-family homes also appear to be dispersed throughout the GTA with a focused cluster of them in the Richmond Hill area.
Summary Data on February and March Rental Data by Bedroom Type and Area
The following figure compares the average rent and average rent per-square-foot, in the former City of Toronto (pre-amalgamation boundaries) to the rest of the GTA by bedroom type for Q1-2022 (first two months of the year only).
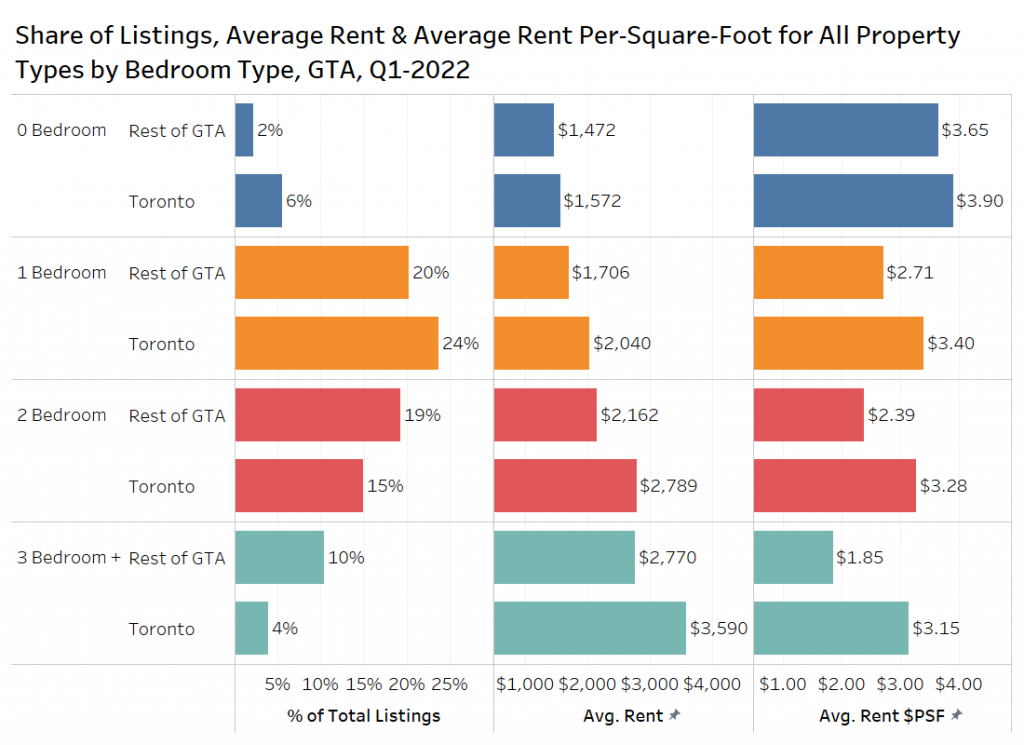
As would be expected, the average rent in Toronto was higher than the rest of the GTA for all bedroom types. The biggest gap was found in three-bedroom or larger units, with pricing at $3,590 per month in Toronto and $2,770 per month in the rest of the GTA.
Studio units accounted for just 8% of the listings in the GTA, with the majority of those listings in Toronto. Per-square-foot rents were highest for studios at $3.90 in Toronto and $3.65 in the rest of the GTA.
One-bedroom units were the most prevalent unit type with 44% of the listings. One-bedroom units in the rest of the GTA had an average rent of $1,706 per month, while one-bedroom units in Toronto had an average rent of $2,040 per month – a premium of just under 20%.
Postal Code
The following figure presents the year-over-year change in the average rent per-square-foot by postal code in the GTA (centered around the downtown core)
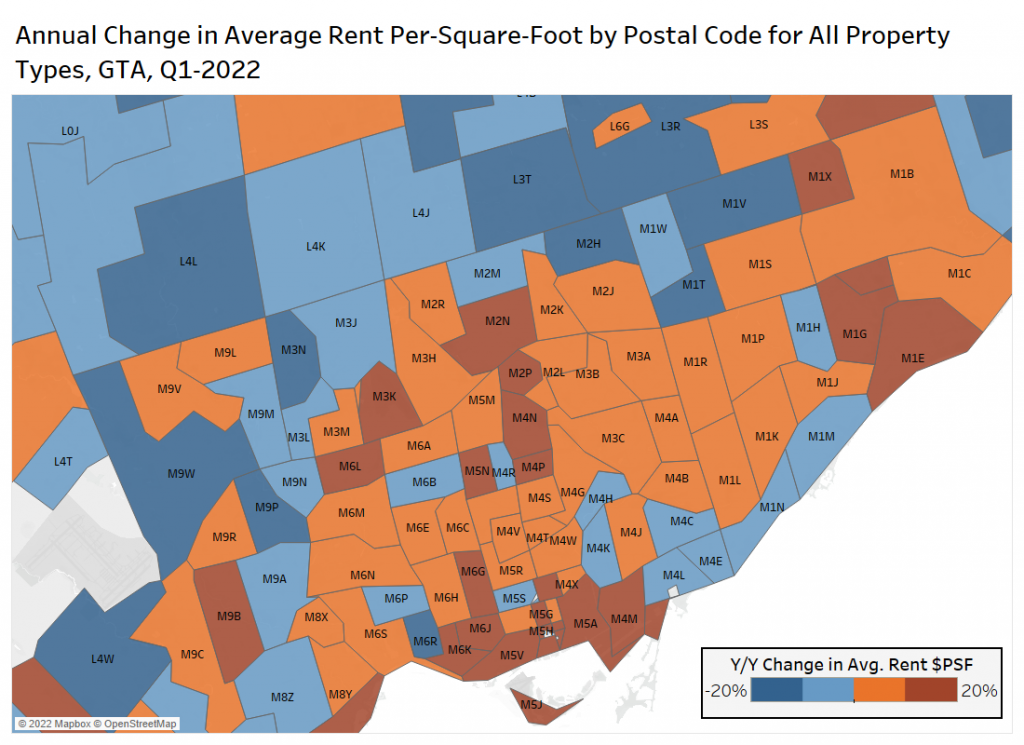
The majority of the postal codes that experienced a significant year-over-year increase in average rent per-square-foot were those in the downtown core, including M6K, M6J, M5V, and M5H.
Looking just north of the downtown Toronto area, there are several postal codes that experienced notable declines in average rent per-square-foot, including L4L, L3T, M2H, and L3R. This suggests that tenants are looking to move back downtown and away from these more suburban areas as life begins to return to normal.
Conclusion
After two years of a pandemic-induced lockdown, the rental market is recovering as the province gets back to normal.
The average rent has steadily increased across all property types. More specifically, condo apartments have seen monthly rental rates increase consistently throughout 2021 and year-to-date in 2022. Apartment rental rates have also increased, although at a much slower rate.
Downtown Toronto has experienced a high annual increase in average rental rates as workers return to the office, and the most desirable amenities are back open at full capacity.
In general, the downtown Toronto postal codes are seeing rental rates increase significantly, while the areas outside the downtown core such as Thornhill and Rexdale are seeing average rental rates decline annually.
Bullpen Research & Consulting expects the recent trends to continue moving forward as the market continues to recover from the pandemic. Immigration is expected to remain high, higher interest rates could discourage buying, and employers are encouraging their staff to return to the office. All of these factors should push up rents in the spring of 2022.