Greater Toronto Area Rental Apartment Market
The Average Rent for All Property Types in the GTA has Declined by 13% Annually in October 2020
The top panel in the chart below presents data on the average monthly asking rent for GTA rental listings (all property types: basement apartments, apartments, condo apartments, townhouses and other single-family homes) from January 2020 to October 2020.
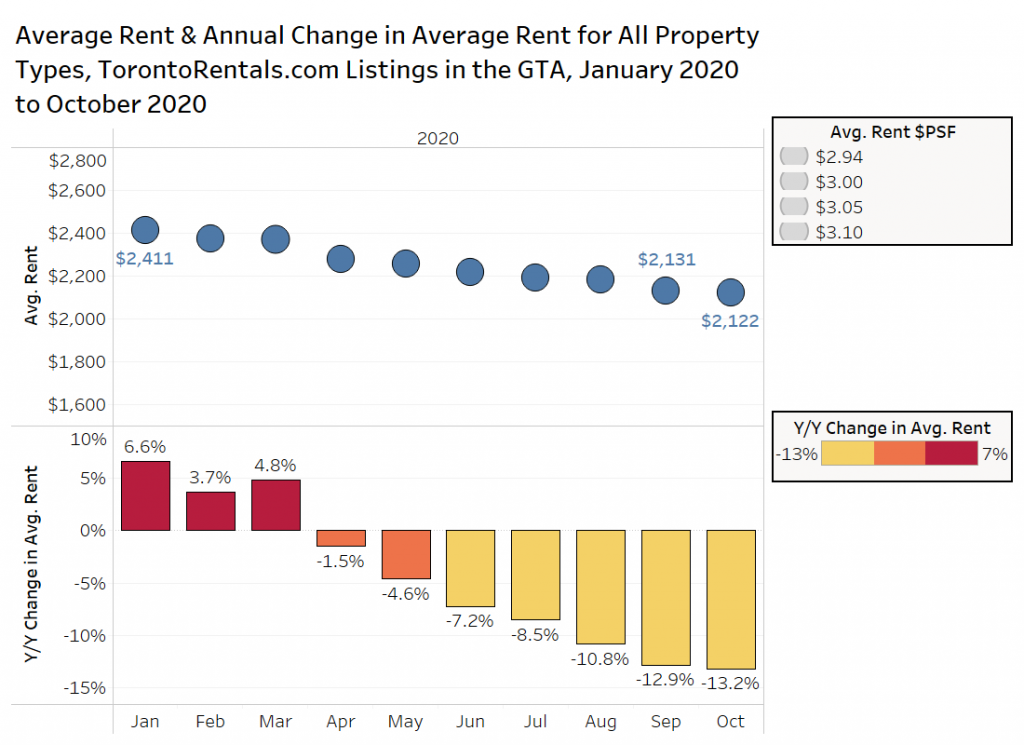
The average rent was approximately $2,120 per month in October, the 11th consecutive monthly decline (includes December 2019, which is not shown). The average rent is down 0.4% monthly, and 13.2% annually (bottom panel). Prior to the pandemic, rents were increasing by 4% to 6% year-over-year.
Average Rental Rates by Bedroom Type
The chart below presents data on the average rent by bedroom type in the GTA from January 2020 to October 2020 for all property types. Six-bedroom units have been removed from the chart, as the small sample sizes lead to monthly volatility.
Average Asking Rents for One-Bedroom Units Down 12% annually, Two-Bedrooms Down 10% annually
In January of 2020, studio, one-bedroom, and two-bedroom units were all flirting with double-digit rent growth in the GTA, but the global pandemic quickly shifted the market, and rental rates have slowly declined since then.
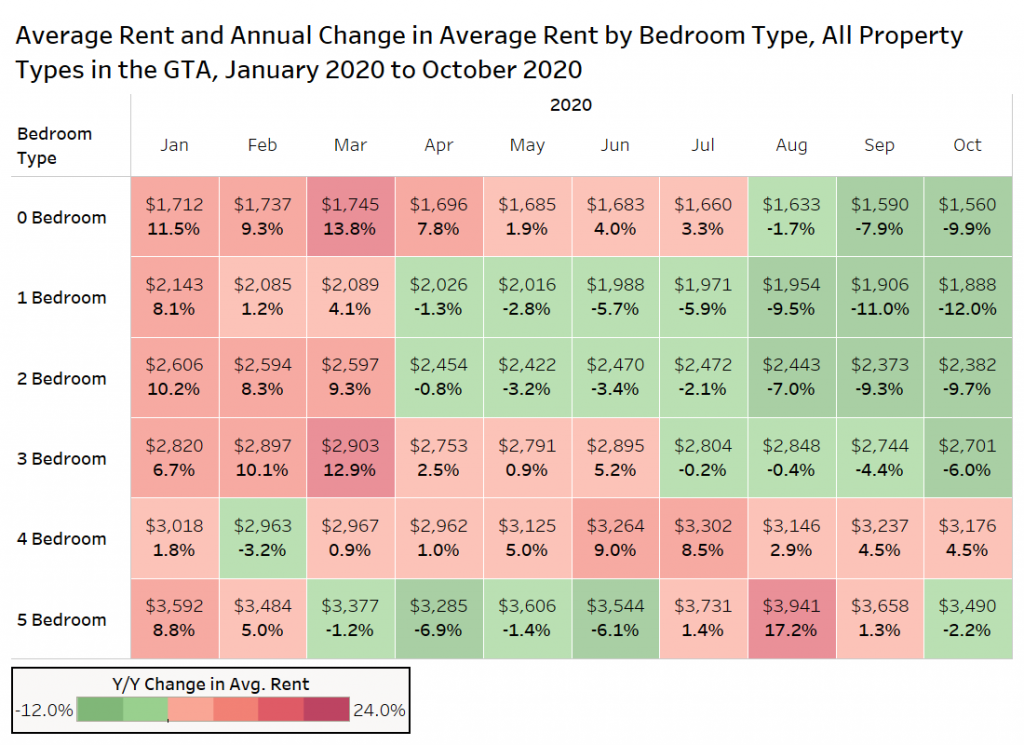
Studio units have experienced an annual rent decline of about 10% in October 2020, with one-bedroom units down 12%, two-bedroom units down 10%, and three-bedroom units down 6%.
Four-bedroom units, which are primarily suburban single-family or townhouse product, have experienced rent growth year-over-year of 4.5%, but the sample size is not large, and the results are volatile on a monthly basis as the composition of the sample changes rapidly (based on location and unit size).
Average Rental Rates by Property Type
GTA Condo Rental Rates are Down 16% Year over Year
Figure 3 presents GTA data on the average rent for single-family homes, condominium apartments and rental apartments over the past two years via Rentals.ca listings data.
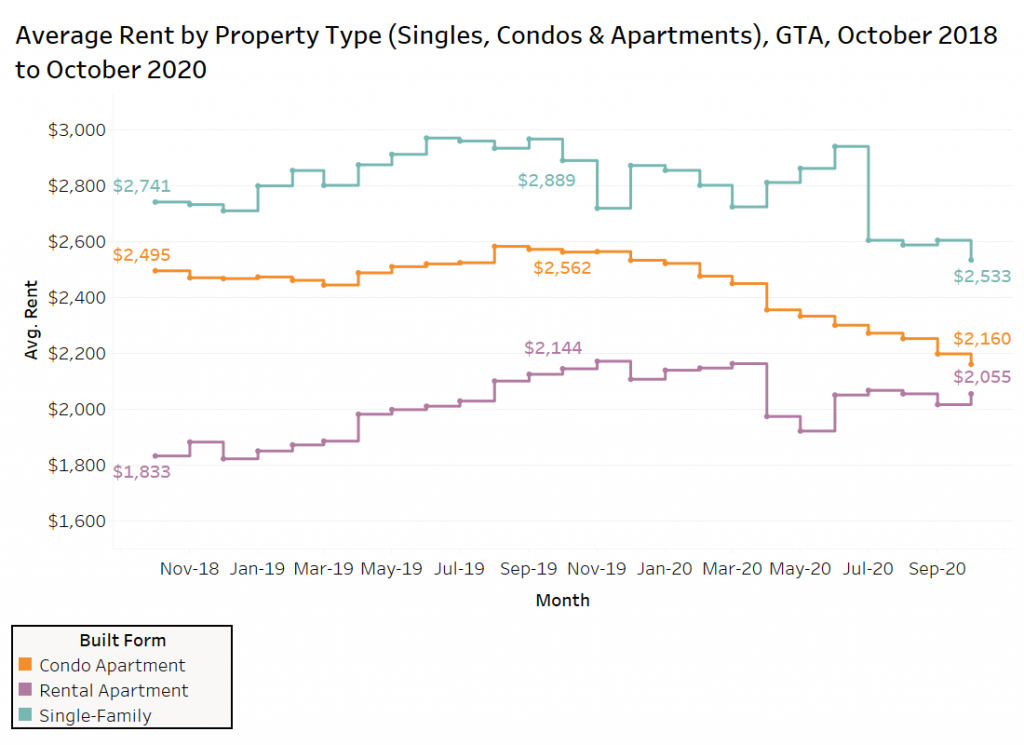
In October of 2019, the average rent for single-family properties in the GTA was about $2,890 per month, an increase of 5.4% annually. As of October 2020, average rent has declined by 12.3% year over year to just over $2,530 per month.
The average rent for rental apartments was up by a whopping 17% in October 2019 at just under $2,150 per month. The average rent for apartments peaked at $2,150 per month in November 2019. As of October 2020, rent is now down 4.2% annually. However, these are asking rents, and the decline is muted by the addition of a number of new units (a high number of expensive listings have been added to the sample). Secondly, many owners and landlords are offering one or two months of free rent, as opposed to dropping their asking rent.
Condo apartments have steadily declined from August of 2019 to October 2020, a 16% drop from last year’s peak rent level. On average, a tenant looking at a condo to lease paid $400 less in October 2020 versus October 2019.
Average Rents by Municipality
Average Rent in the Former City of Toronto is Down 17% Annually
The chart below looks at the average rent for all property types in select municipalities in Ontario in October 2020 (Toronto is broken up into its former municipalities, prior to amalgamation). The right side of the chart shows the average annual change in average rent, while the thickness of the bars represents the average unit size in the sample listings.
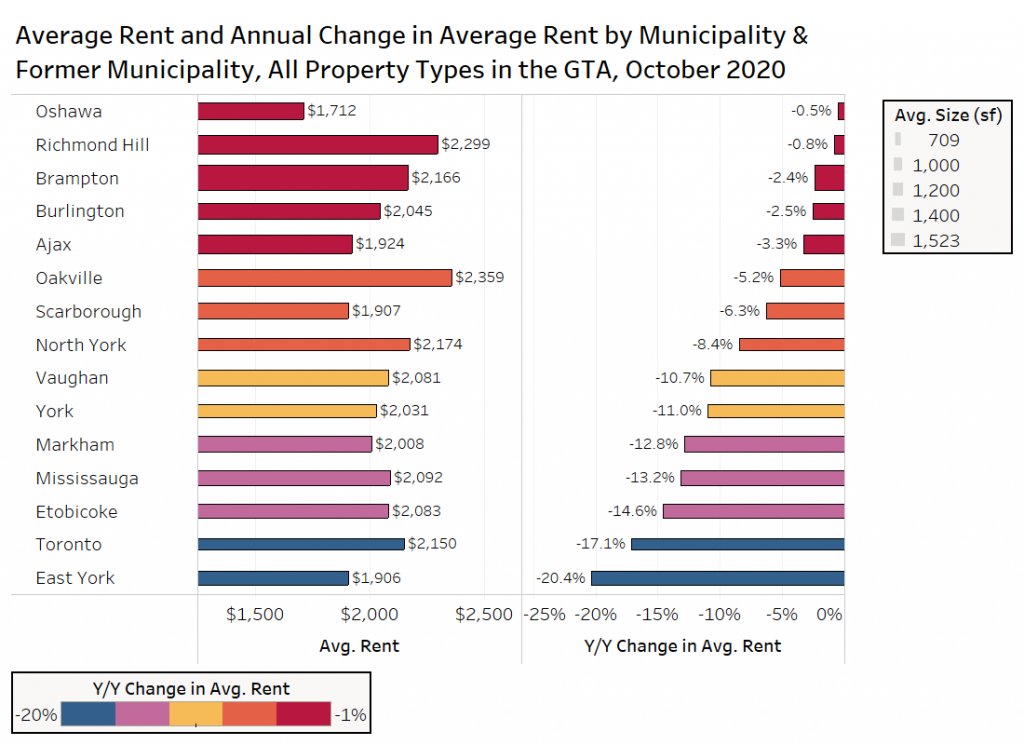
The suburban communities are faring better than the ‘416’ area, with Oshawa, Richmond Hill, Brampton, Burlington and Ajax all experiencing declines of less than 4% year over year.
However, the former municipalities that make up the amalgamated City of Toronto have all experienced significant declines, including East York (-20%), old Toronto (-17%), Etobicoke (-15%), York (-11%), and North York (-8%). Scarborough has not been hit as hard, but rental rates are down 6% from October 2019.
Condo and Rental Apartment Rates for Select Areas
The chart below looks at four municipalities (or former municipalities) in the GTA, Etobicoke, Mississauga, North York and old Toronto. The average rent (coloured horizontal bars) and median rent (black vertical bars) are shown for October 2019 and October 2020, with the average rent and annual change in average rent marked.
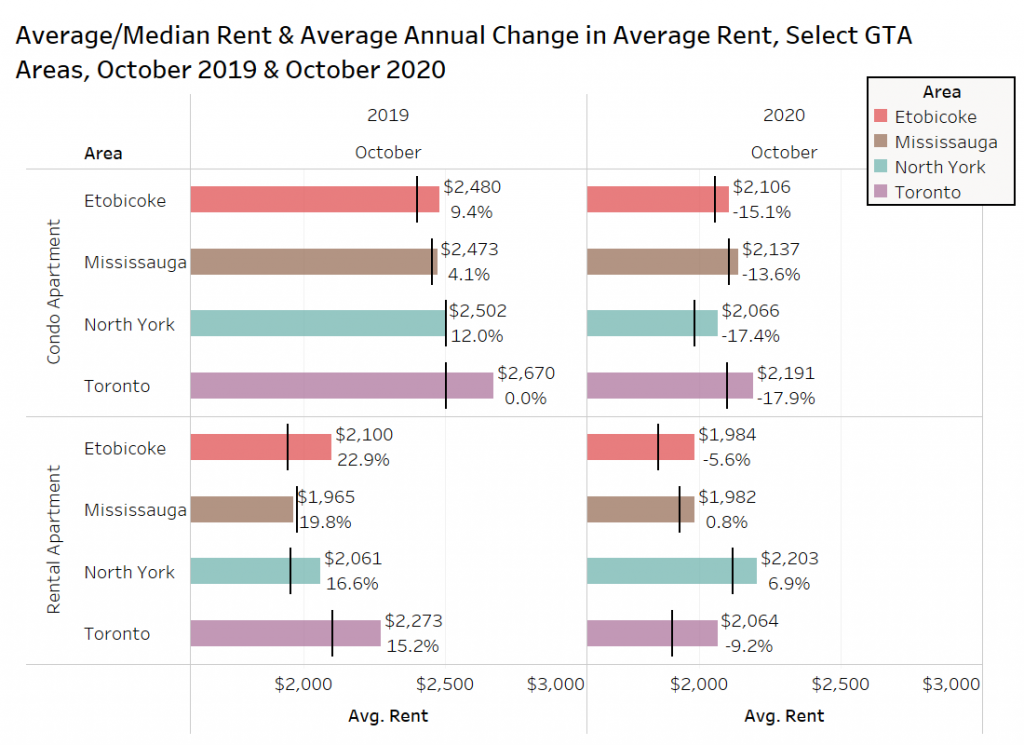
There has been a drastic change in rents in 2020 versus 2019. In Etobicoke. condo rents were up 9% annually in October 2019, but down 15% annually in October 2020. North York was even more extreme, up 12% last year and down 17% this year.
Rent growth for purpose-built rental apartments in 2019 was enormous, with the four areas growing by 15% to 23% in October 2019 on an annual basis. Mississauga rents have continued to grow, while Etobicoke (-6%) and Toronto (-9%) have declined. North York is up year over year, but a number of new listings were added to the sample in October 2019 at new apartments either just occupying, or pre-leasing that skewed the results up.
Condo and Rental Apartment Per-Square-Foot Rent Levels
The condo rental market in downtown Toronto is soft, with the average rent per square foot (psf) down 15.7% year over year ($3.95 psf to $3.33 psf). Rental apartment owners have seen average rents per-foot drop by 10.5% annually in the core (refer to the chart below, upper left-hand corner).
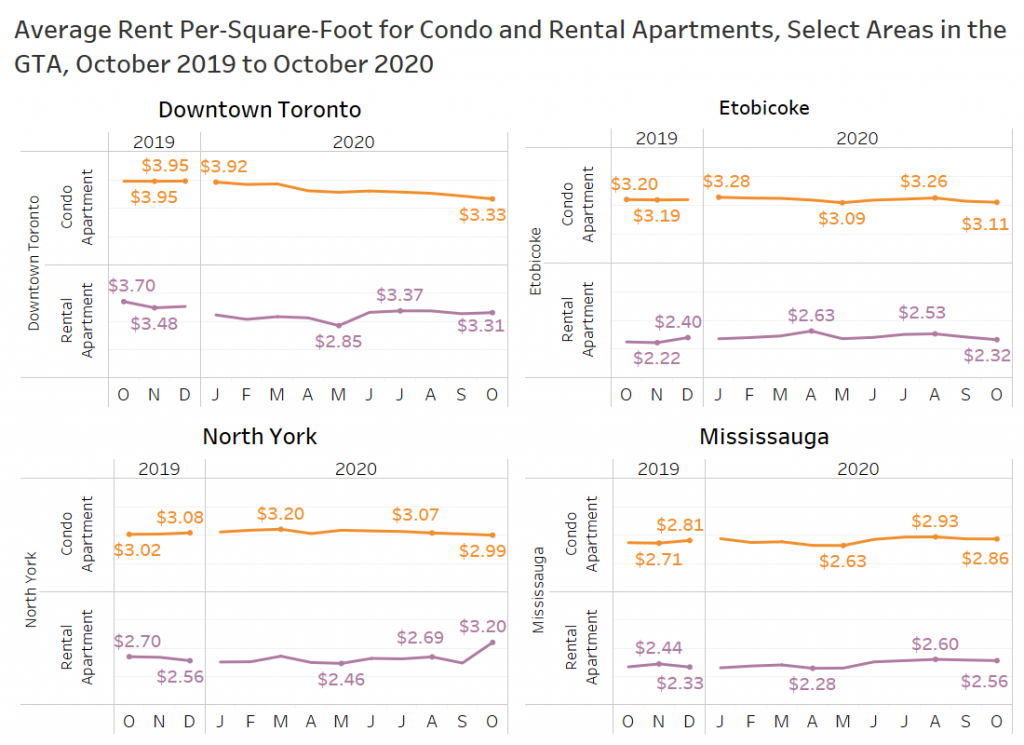
This chart also looks at the average rent per square foot for condo and rental apartments in Etobicoke, North York, and Mississauga. It should be noted that not all properties listed on TorontoRentals.com have their unit sizes available, so this data is based on a smaller sample size, and is a straight average, not a weighted average.
In Etobicoke, average condo rental rates per square foot are down 2.8% annually ($3.20 psf to $3.11 psf), while rental apartment rates have increased from October 2019 to October 2020 by 3.1% ($2.25 psf to $2.32 psf).
In North York, condo rents are nearly identical year over year at about $3 psf, but the rental apartment rate jumped in October after inventory was added from a new purpose-built apartment building.
Mississauga has seen growth, with condos up 4.8% year over year ($2.73 psf to $2.86 psf), and rental apartments up year over year by 9.4% ($2.34 psf to $2.56 psf).
Lease Activity at the Most Active New Condo Apartment Projects in Toronto
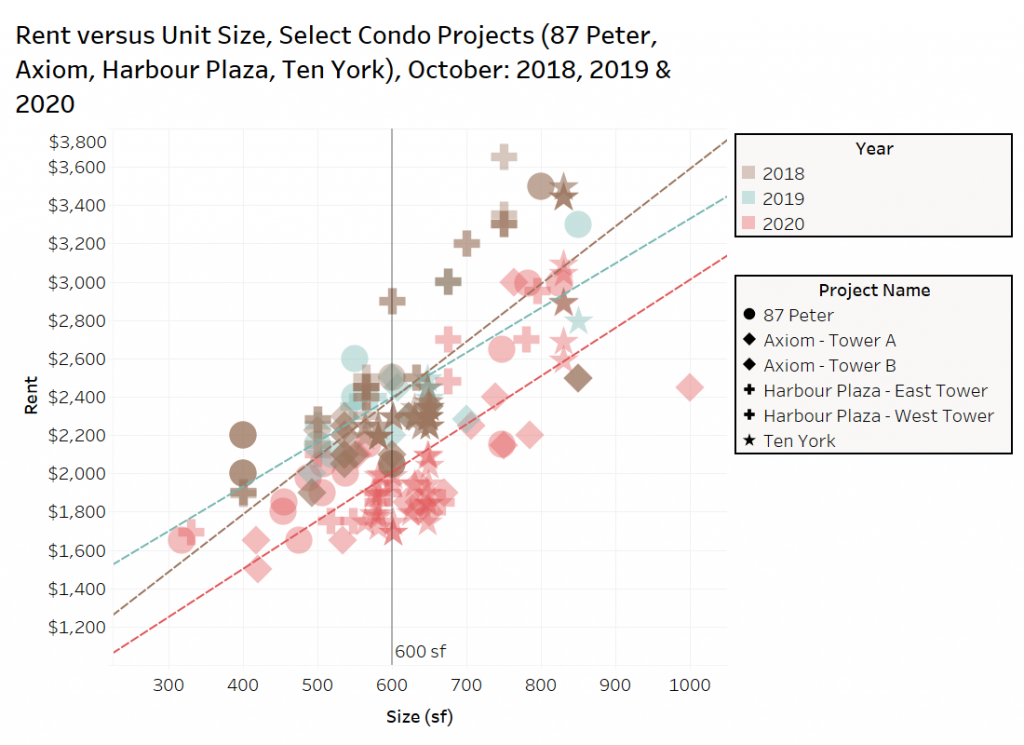
The composition of units in a sample can change month over month and year over year, and it is often worthwhile to try to look at an apples-to-apples comparison to better understand how the market has changed. The chart below looks at four projects (87 Peter, Ten York, Harbour Plaza, and Axiom) in October of 2018, 2019 and 2020, plotting the listings by asking rent and unit size. The dashed lines reflect the linear trendline by year.
In both October 2018 and October 2019, a 600-square-foot unit was offered for rent at about $2,400 per month on average or $4 psf.
In October of 2020, the trendline has moved down and to the right, and a 600-square-foot unit is being offered for about $2,000 per month on average ($3.33 psf), a decline of 17% annually.
The activity at these buildings perfectly mimics the results for the downtown Toronto area as a whole as presented above.
Tenant Lifestyle Findings
The chart below shows the most popular lifestyle searches for tenants in the Vancouver, Toronto and Montreal Census Metropolitan Areas (CMAs).
In all three areas, access to groceries was a top priority for tenants, followed by proximity to transit. In Toronto, elementary schools were very important, more so than in Vancouver or Montreal.
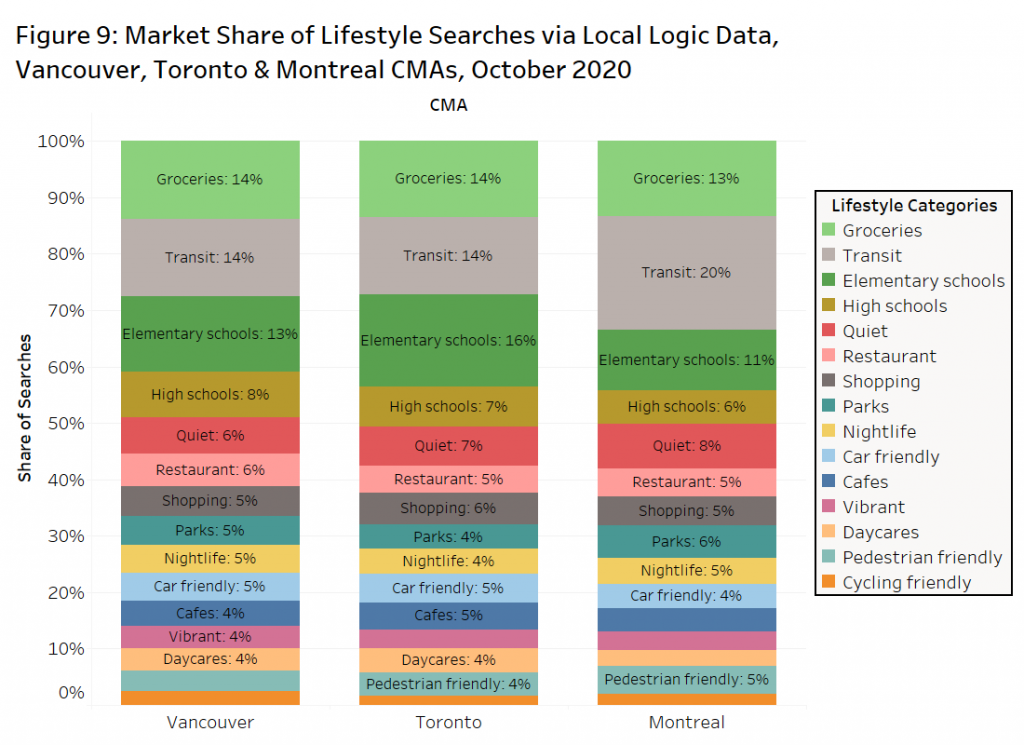
In the Montreal CMA, pedestrian-friendly is more important than car-friendly, while the opposite is true in the Toronto CMA, but the shares are close.
The Desire to Be Close to Transit has Declined during the Pandemic, While Proximity to Grocery Stores has Increased
How have these preferences changed from earlier this year before tenants knew that the work-from-home phenomenon was going to be a longer-term reality?
Figure 10 shows greater interest in being close to grocery stores, a desire to be in a quiet neighbourhood — which makes sense when you’re trying to work — and being in proximity to parks, which is much needed when many activities are shut down due to COVID-19.
On the flip side, with fewer people commuting to work, the desire for car-friendly and transit-friendly locations have subsided slightly in October 2020 compared to March 2020.
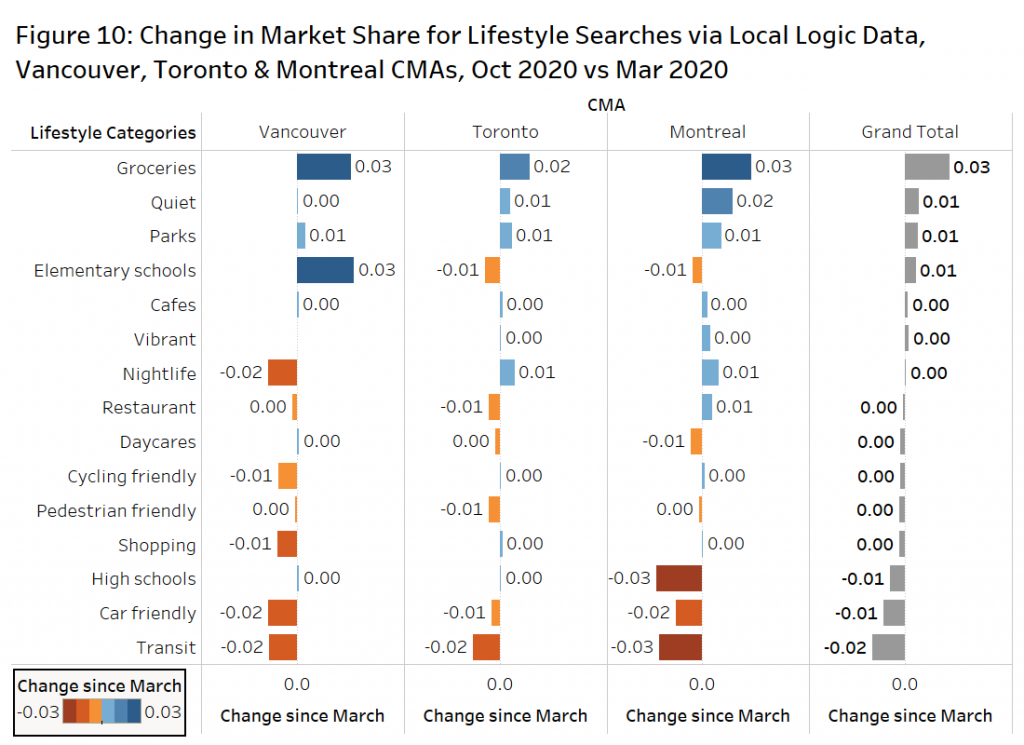
The only change in October over March that was somewhat puzzling, is the increased desire of tenants in the Toronto and Montreal CMAs to be close to nightlife. Many bars and clubs are closed or have reduced hours, but perhaps these tenants are thinking long-term.
Commuting Distance in the GTA
Local Logic is a data company that tracks a number of lifestyle preferences among prospective tenants over a number of real estate portals in Canada. Those preferences can be tracked over time.
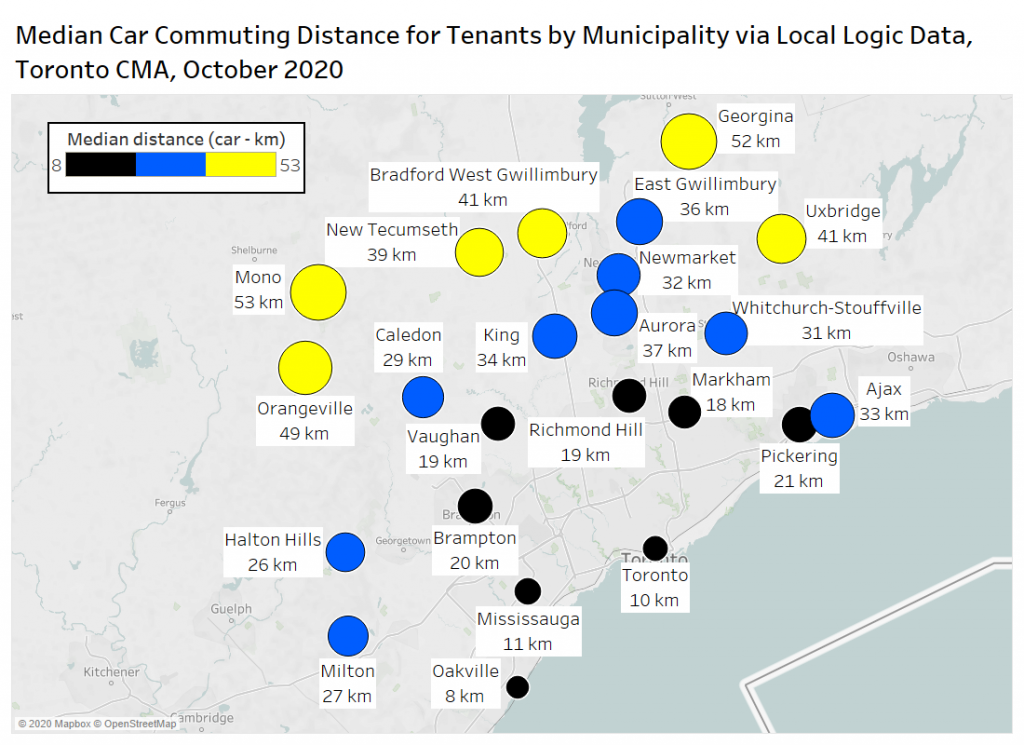
Local Logic also tracks how far tenants are willing to commute based on where they are looking at rental properties and their current home address (see the chart below).
In Toronto, tenants are looking to commute via their car by 10 kilometres on average, and that rate doubles as you hit the inner suburban markets of Vaughan, Richmond Hill, Markham and Pickering. That commuting distance increases by another 10 km for the next ring of areas such as Milton, Halton Hill, Caledon, King City, Newmarket, Ajax, and Whitchurch-Stouffville. The outer suburbs see tenants looking at commutes of 40 km to 50 km in places like Orangeville, Mono, New Tecumseth, Bradford, East Gwillimbury, Georgina and Uxbridge.
Neighbourhood Searches by Rent Range
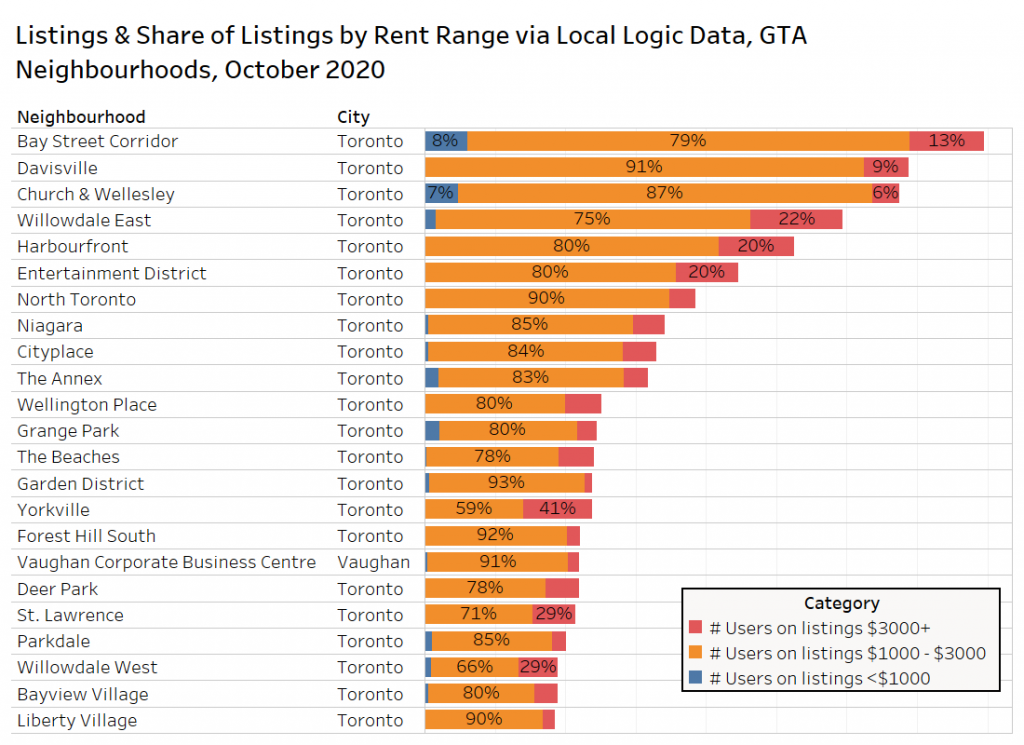
The chart below looks at the number of searches for specific areas in the GTA using data from Local Logic.
The Bay Street Corridor in Toronto was the most searched area, with 79% of those searches for properties from $1,000 to $3,000 per month.
The second most popular area by online searches was Davisville, with over 90% of prospective tenants looking at properties from $1,000 to $3,000 per month.
The Church-Wellesley area was third, with 87% of the searches for product from $1,000 to $3,000 per month.
Conclusion
The average asking rent for all property types in the GTA has declined by over 13% annually in October. The pre-leasing of new purpose-built rental apartments prevented the decline from being even steeper. The suburban markets are holding up better than downtown Toronto, where rents have declined by 15% to 17% annually.
With the recent announcement that a COVID-19 vaccine could be available next year, and a commitment from the federal government to significantly boost immigration, consumer confidence and rental demand could start to increase, but not likely until the new year. The pandemic’s second wave continues to wreak havoc on the service industry, and job losses are impacting renters more than owners. So the rental market is clearly not safe in the short term. Expect additional supply via completions and evictions, as landlord and tenant boards wade through the backlog, and government financial assistance programs are discontinued.
Real Estate Investment Trusts, developers and institutional owners still believe there will be a return to downtown and the work-from-home phenomenon will lose its luster. However, this might take another year to two years to get sorted out.
The data suggests further declines in average rents should be expected in the slower-demand months of November, December and January, and the annual drop in average rent in Toronto could exceed 20%.
Disclaimer
The information, statements, statistics and commentary contained within this report that was prepared by Bullpen Research & Consulting Inc. (“Bullpen”) utilized data and information from various secondary sources, as well as various discussions with industry participants. Bullpen based this report on information received or obtained, on the basis that such information is correct. Bullpen does not warrant the accuracy or completeness of the information provided or any assumptions or conclusions made by the parties that provided the information.
While Bullpen made every effort to present accurate and reliable information in all the material as provided, Bullpen does not endorse, approve, or certify such information, nor does it guarantee the accuracy, completeness, efficacy, timeliness, or correct sequencing of such information. Use of such information is voluntary, and reliance on the information should only be undertaken after an independent review. Reference herein to any specific information, material or otherwise provided, does not constitute or imply endorsement, recommendation, or favouring by Bullpen.
Bullpen assumes no responsibility, financial or otherwise, for consequences resulting from the use of the material or information herein, or in any respect for the content of such information, including (but not limited to) errors or omissions, the accuracy or reasonableness of factual or scientific assumptions, studies or conclusions, research, the defamatory nature of statements, ownership of copyright or other intellectual property rights, and the violation of property, privacy, or personal rights of others. Bullpen is not responsible for, and expressly disclaims all liability for, damages and/or losses and/or risks, personal, professional, commercial or of any kind arising out of use, reference to, or reliance on such information. No guarantees or warranties, including (but not limited to) any express or implied warranties of merchantability or fitness for a particular use or purpose, are made by Bullpen with respect to such material and/or information. Bullpen and any sub-consultant contracted for this report make no warranty or representation regarding the results or performance that may be obtained from the use of the material or information as provided and/or regarding the accuracy or reliability of any information, or that Bullpen and the sub-consultant’s information or material will meet any user’s requirements, be uninterrupted, timely, secure or error-free. Bullpen reserves the right to change any information or material without notice or warranty.