Greater Toronto Area Rental Apartment Market
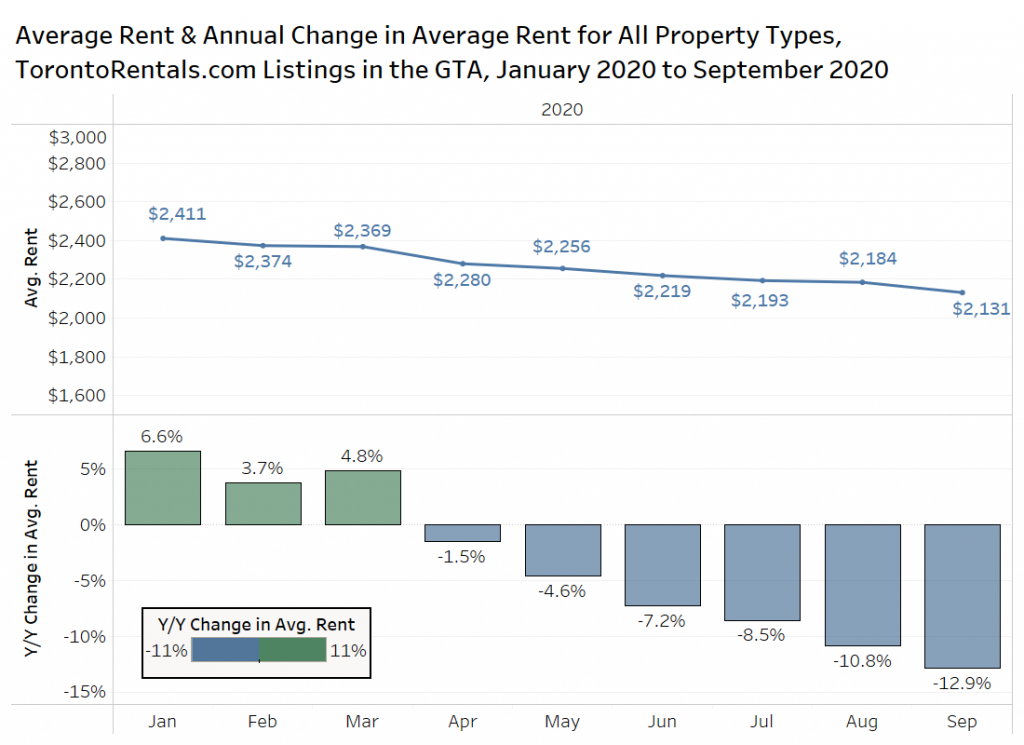
The average monthly asking rent for GTA rental listings on TorontoRentals.com continues to trend downward in the GTA (includes all property types: basement apartments, rental apartments, condo apartments, townhouses and other single-family homes).
The average rent was approximately $2,131 per month in September, the 10th consecutive monthly decline (top panel in the chart below – also declined in December 2019, which is not shown). The average rent is down 2.4% monthly, and 12.9% annually, as shown in the bottom panel below.
Average Rental Rates by Bedroom Type
The average rent by bedroom type in the GTA from January 2020 to September 2020 is presented next. Five- and six-bedroom units have been removed from the chart, as the small sample size leads to monthly volatility.
Average Asking Rents for One Bedroom Units Down 11% annually, Two Bedrooms Down 9% annually
Studios, one-bedroom, and two-bedroom units have seen their average rent slowly decline from the fall of 2019 to September 2020, with one-bedroom and two-bedroom units recording year-over-year declines of 11.0% and 9.3% respectively.
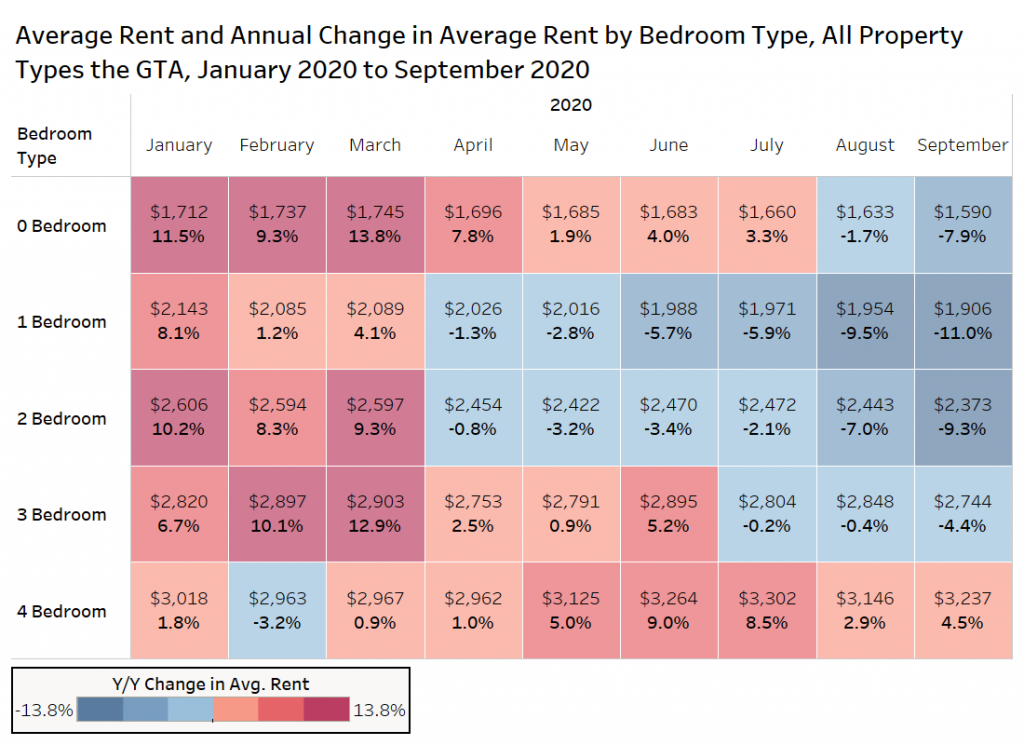
The average rental rate for four-bedroom units has increased year-over-year by 4.5%, likely due to demand from tenants looking for larger single-detached properties with more space outside the downtown core of Toronto.
If we looked at four-bedroom rents just in the old City of Toronto (pre-amalgamation boundaries), they are down 9.5% annually. Landlords are asking themselves how permanent this situation is, and questioning whether they should sell or not, as the resale market in Toronto remains relatively strong for low-rise housing types.
Asking Rents for Condominium and Rental Apartments
The bar graph below presents data on the average asking rent for condominium apartments (orange) and rental apartments (purple), in the GTA (top panel) and former City of Toronto (bottom panel). As a reminder, this refers to the former City of Toronto or old Toronto, using the pre-amalgamation boundaries.
Landlords in the GTA were asking $2,571 per month for condo apartments in September of 2019 and $2,199 per month in September of 2020, a 14.5% annual decrease. Rental apartments have declined by 5.1% annually over the same period from $2,124 per month to $2,016 per month.
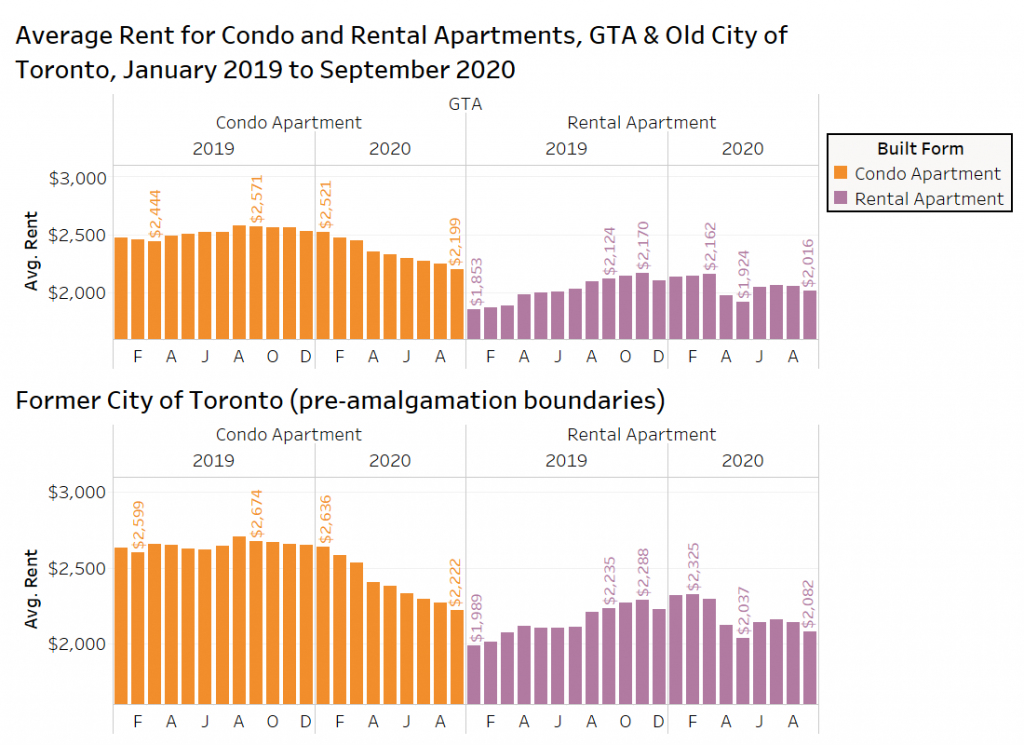
The condo rental market in old Toronto is in bad shape (if you’re a landlord), with the average rent down 16.9% year-over-year to $2,222 in September 2020. Rental apartments have seen average rent drop by 6.8% annually to $2,082.
The rental market in downtown Toronto is really pulling the GTA averages down. The line graph below looks at the average rent per square foot for condo and rental apartments in downtown Toronto, Etobicoke, North York, and Mississauga. It should be noted that not all properties listed on TorontoRentals.com have their unit size available, so this data is based on a smaller sample size, and is a straight average, not a weighted average. Secondly, many old rental apartments do not have unit sizes available, so the rent per square foot shown likely skews high, as it includes a higher share of newer apartments.
The average rent per square foot (psf) for downtown Toronto condos is down 13.6% annually to $3.43 psf from $3.97 psf a year earlier, while rental apartments are down 10.4% annually to $3.27 psf.
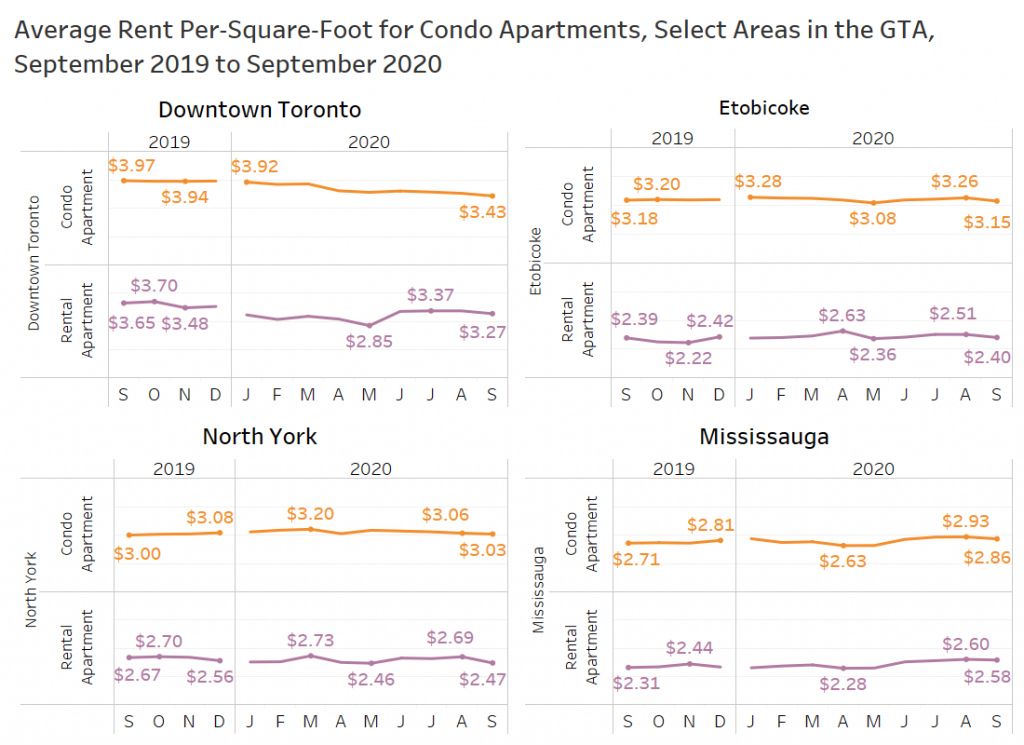
In Etobicoke, average condo rental rates per square foot are down 0.9% annually, while rental apartment rates are virtually the same in September 2019 versus September 2020. In North York, condo rents increased by 1.0% in September 2020 over the same month last year, while rental apartments are down 7.5% (following a big drop month over month). Mississauga has actually seen growth, with condos up 5.5% year over year, and rental apartments up a whopping 11.7%.
Average Rental Rates by Property Type in Old Toronto
The average rent by property type in the former City of Toronto over the past 21 months is displayed in the chart below, with the September 2020 result in red. The condo apartment market is at its lowest point during this period, with an average monthly rental rate of $2,245 per month, down from the August 2019 high of $2,707 – a potential savings for the average prospective tenant of $462 per month.
Rental apartment average rents are toward the lower end of the range at $2,085 per month, down from the pre-pandemic market high of $2,325 in February 2020.
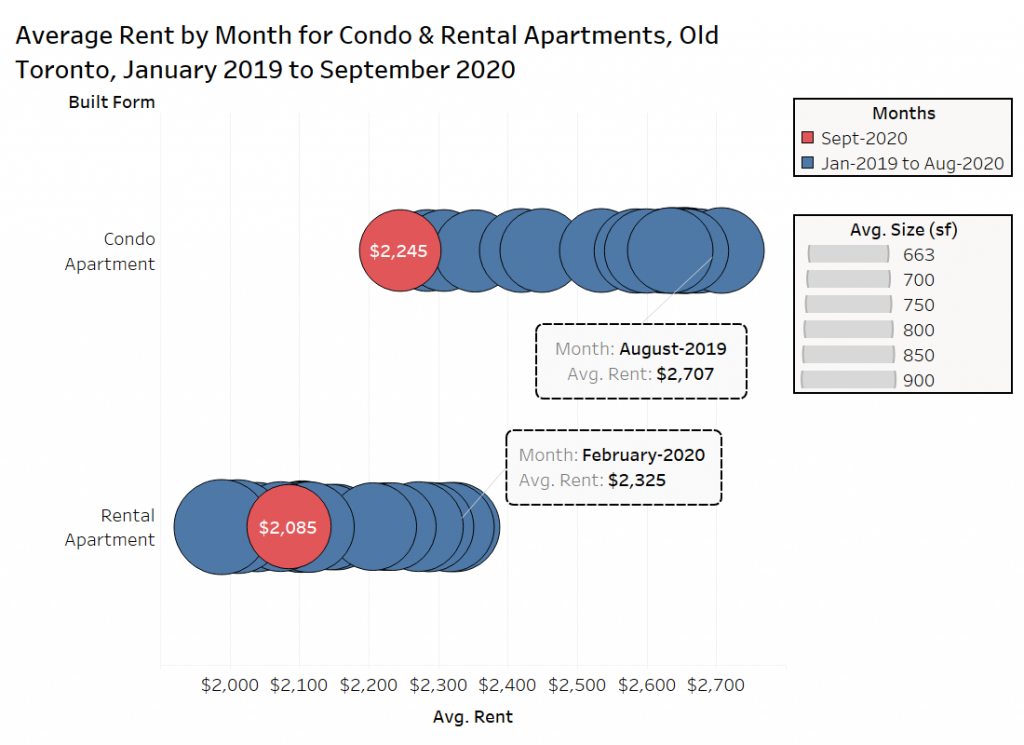
Condo apartments are cheaper on average in September 2020 than rental apartments were on average in October 2019.
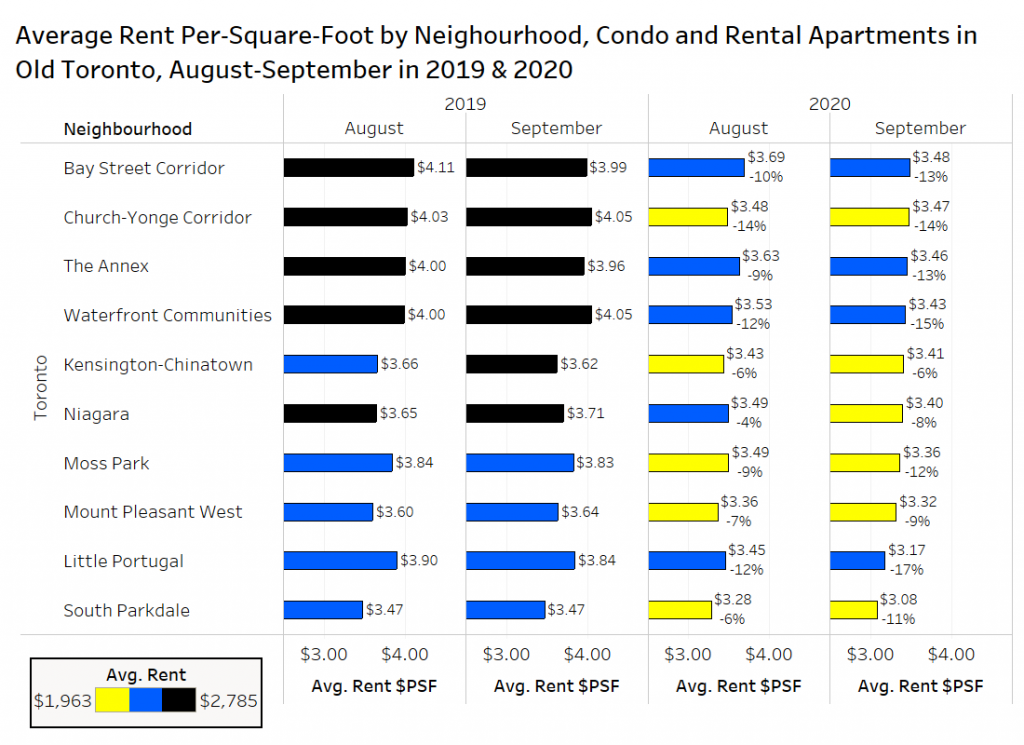
Rental Rates by Neighbourhood/Postal Code in Old Toronto
Data visualized below shows the average rent per square foot and annual change in average rent per square foot for condominium apartments and rental apartments in August and September of 2020 versus the same two months in 2019 for select neighbourhoods in the City of Toronto.
All 10 neighbourhoods have declined, with seven of them experiencing double-digit deflation in their average rent per square foot year over year, with the Waterfront Communities (boundaries shown in the inset map below) down 15% year over year, and the Little Portugal neighbourhood down 17%.
The smallest decline is in Kensington-Chinatown, which likely has to do with the fact that there are not many new condo projects with high rents in that neighbourhood in comparison to the four areas with higher per-foot rent levels.
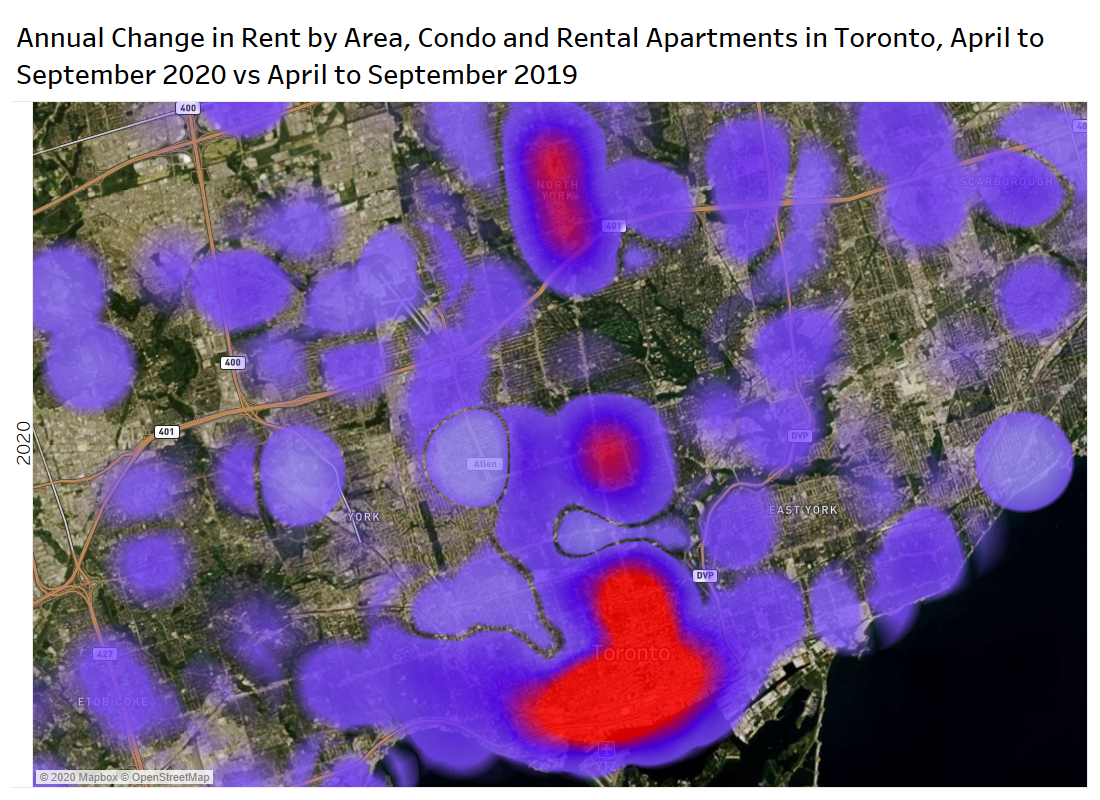
The density map below looks at the change in condo and rental apartments rents by area, the read zones represent the areas with the biggest declines: Downtown core, Yorkville and the North York City Centre.

Average Rental Rates for 500 sf, 800 sf and 1,000 sf Apartments in Select Areas
There has been a lot of discussion about the desire for larger units due to people working at home, and the data substantiates that claim in old Toronto, with units rounded to 500 sf seeing average rents for condo and rental apartments decline by 8% annually, while 800 sf units declined by 5%, and 1,000 sf units actually up 1% year over year.
In Mississauga, the market decline has been consistent, with a 5% decline for 500 sf, 800 sf and 1,000 sf.
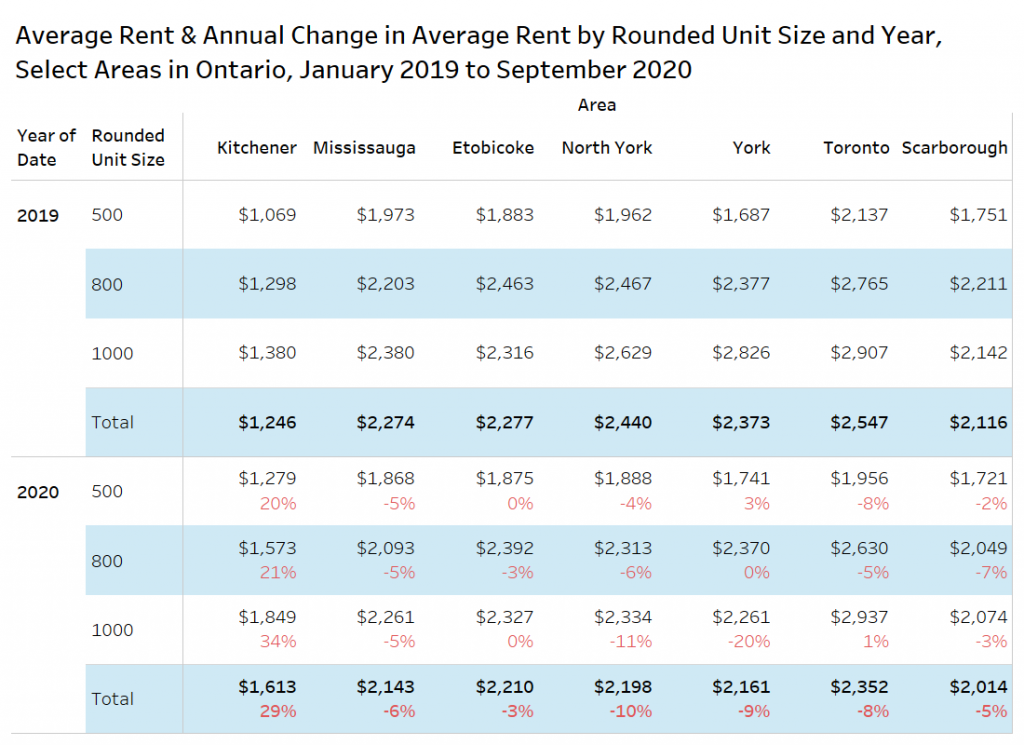
There has also been a lot of media coverage of the urban exodus to smaller municipalities, and many local Kitchener real estate agents are reporting that tenants are moving to Kitchener for cheaper rents and larger apartments or condos. Rental rates for 500 sf units in Kitchener are up 20% annually, 800 sf units are up 21% annually, and 1,000 sf units are up 34% annually.
Listings for Toronto Condo Rentals in Old Toronto
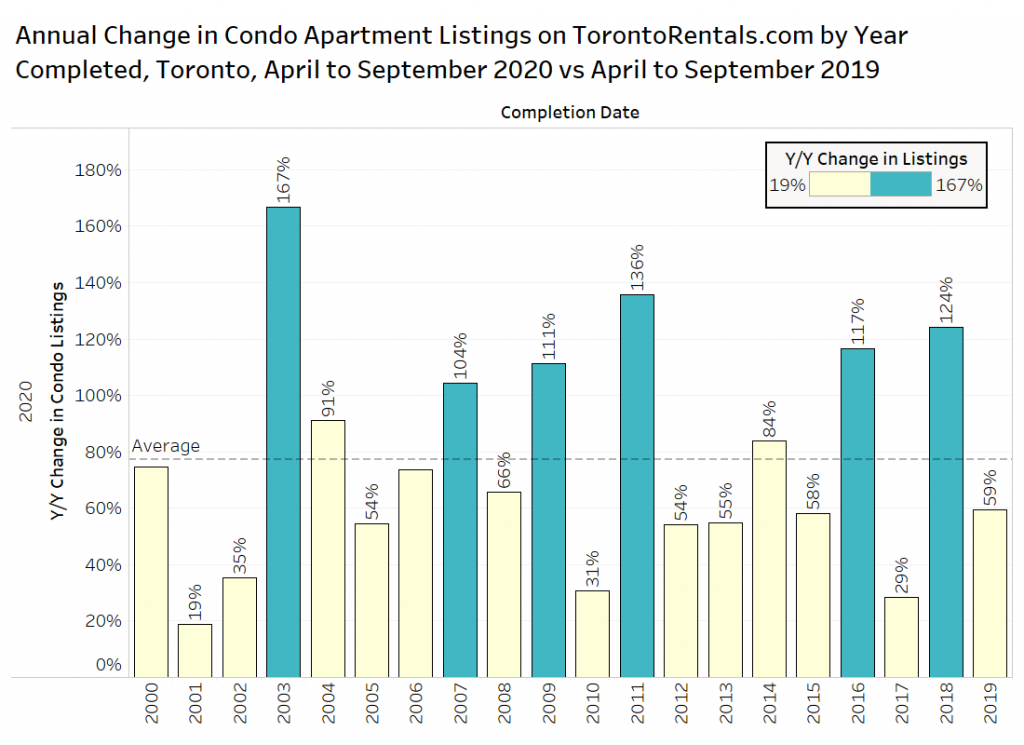
Listings for condo rentals in the City of Toronto continue to increase with the decline in demand and increase in supply. The chart below presents data on the change in the number of condo rental units listed in Toronto on TorontoRentals.com by the year the building was completed. Every single year experienced an increase, from a low of 19% growth for buildings completed in 2001 to 167% for buildings completed in 2003.
One might hypothesize that listing growth would be higher for newer buildings because their rent is higher and those buildings contain a higher share of investor-owners, however listings growth was only higher than the average growth rate in three of the last eight years.
That said, growth in the newer buildings is based on a much larger number of listings from last year.
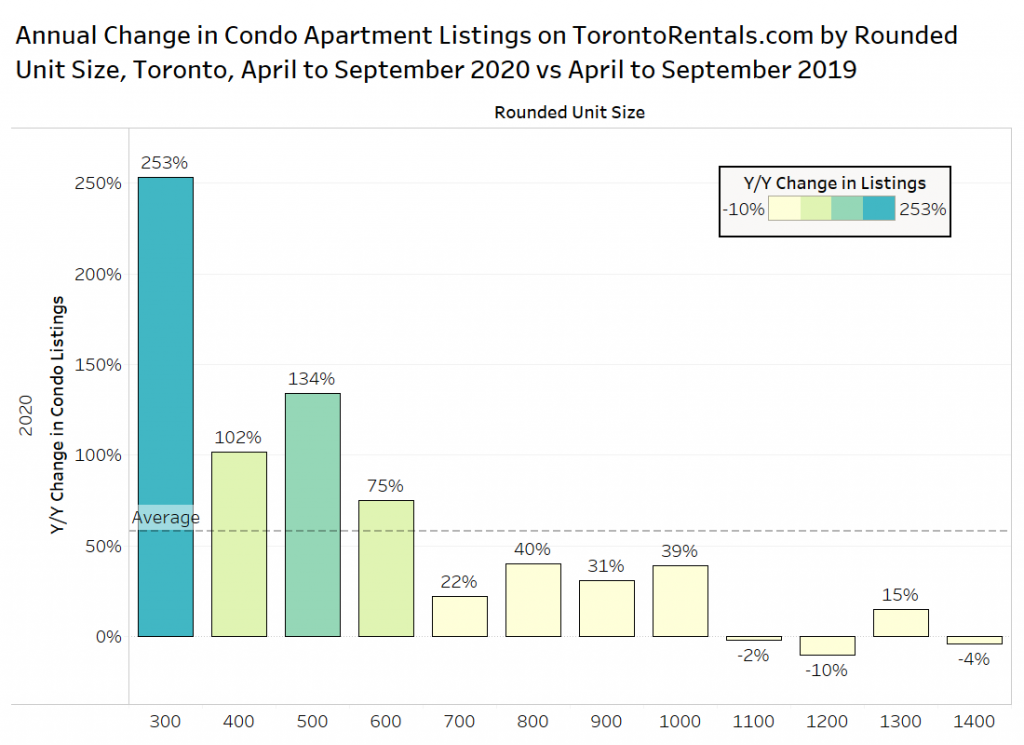
The change in listings by rounded unit size is not surprising given the rental data, supply is way up for the smallest units, and down for three of the four largest unit sizes (excludes suites above 1,450 square feet due to small sample sizes).
Listings for micro-suites rounded to 300 sf have increased by 253%, with 400 sf units seeing listing spike by 102%, and 500 sf units seeing listings jump by 134% in April to September 2020 versus the same period last year.
Apartment Units Under Construction in the Toronto CMA
The line graph below presents data from the Canada Mortgage Housing Corporation on the number of apartment units under construction in the Toronto Census Metropolitan Area since January 2010.
There were 57,602 condominium apartment units under construction in the metro area at the end of September 2020, an increase of 5% year over year, and the figure is just below the record high set last month.
The 10,408 units of rental apartment supply under construction in September is down slightly from last month’s figure, but up 35% annually. The average level of rental apartments under construction in 2020 is higher than any time over the last 30 years.
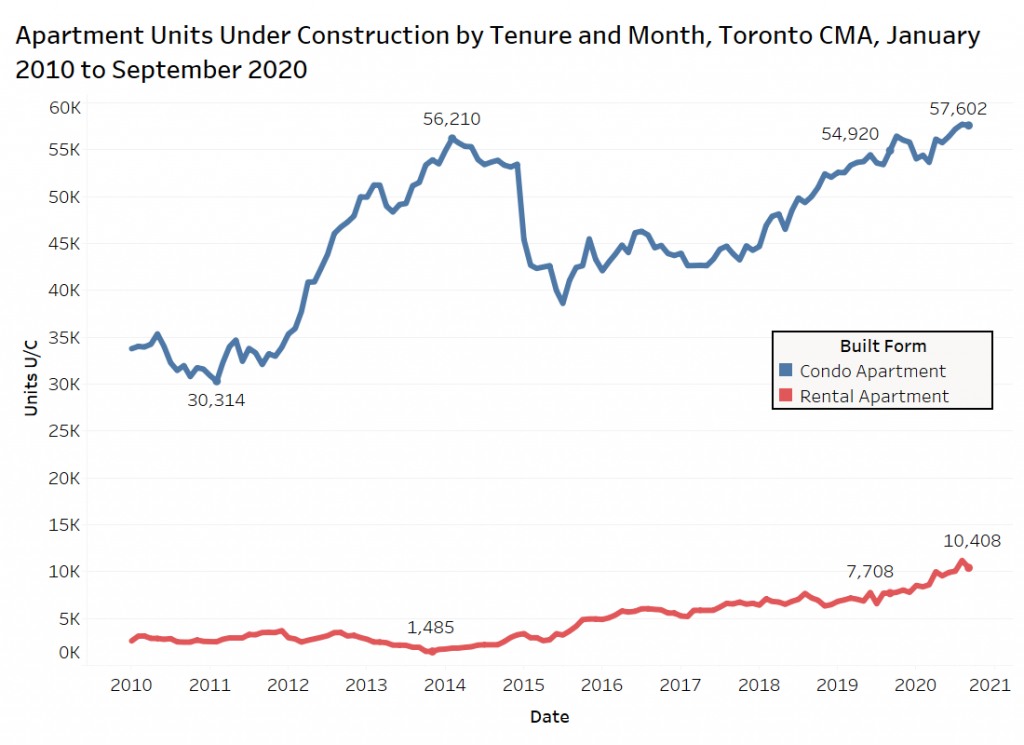
Many of these apartments will be completed in 2021 and 2022, and will continue to add to the supply of apartments for rent. This could have a further dampening effect on rents if a vaccine is not approved during that time.
Conclusion
The average rental rate in the GTA is now down 13% annually, but when controlling for bedroom types, one-bedroom suites are down 11% and two-bedroom units are down 9%.
This unfortunately doesn’t tell the entire story, as several landlords, especially owners of recently completed high-end apartments, are offering significant discounts or incentives such as two months of free rent.
Several investors who own condo apartments that they have previously rented out are listing their suites for sale as downtown tenant-demand craters, and resale condo supply has skyrocketed. However, resales are still occurring and leases are still happening. Data-tracking firm Urbanation recently released data that suggests the purpose-built rental apartments in the GTA built since 2005 had a vacancy rate of 2.4% in Q3-2020 (still low), but the rate was three times higher than in Q3-2019 (0.8%). In old Toronto the vacancy rates increased to 2.8% from 0.7% a year earlier.
Weakness is expected to continue with the excess supply and work-from-home phenomenon firmly in place for many employers moving forward. That said, employment is picking up, international students are being let into the country, and rents will eventually go to a level that start to attract people out of their parents’ home and out of roommate situations.
Disclaimer
The information, statements, statistics and commentary contained within this report that was prepared by Bullpen Research & Consulting Inc. (“Bullpen”) utilized data and information from various secondary sources, as well as various discussions with industry participants. Bullpen based this report on information received or obtained, on the basis that such information is correct. Bullpen does not warrant the accuracy or completeness of the information provided or any assumptions or conclusions made by the parties that provided the information.
While Bullpen made every effort to present accurate and reliable information in all the material as provided, Bullpen does not endorse, approve, or certify such information, nor does it guarantee the accuracy, completeness, efficacy, timeliness, or correct sequencing of such information. Use of such information is voluntary, and reliance on the information should only be undertaken after an independent review. Reference herein to any specific information, material or otherwise provided, does not constitute or imply endorsement, recommendation, or favouring by Bullpen.
Bullpen assumes no responsibility, financial or otherwise, for consequences resulting from the use of the material or information herein, or in any respect for the content of such information, including (but not limited to) errors or omissions, the accuracy or reasonableness of factual or scientific assumptions, studies or conclusions, research, the defamatory nature of statements, ownership of copyright or other intellectual property rights, and the violation of property, privacy, or personal rights of others. Bullpen is not responsible for, and expressly disclaims all liability for, damages and/or losses and/or risks, personal, professional, commercial or of any kind arising out of use, reference to, or reliance on such information. No guarantees or warranties, including (but not limited to) any express or implied warranties of merchantability or fitness for a particular use or purpose, are made by Bullpen with respect to such material and/or information. Bullpen and any sub-consultant contracted for this report make no warranty or representation regarding the results or performance that may be obtained from the use of the material or information as provided and/or regarding the accuracy or reliability of any information, or that Bullpen and the sub-consultant’s information or material will meet any user’s requirements, be uninterrupted, timely, secure or error-free. Bullpen reserves the right to change any information or material without notice or warranty.