Greater Toronto Area Rental Apartment Market
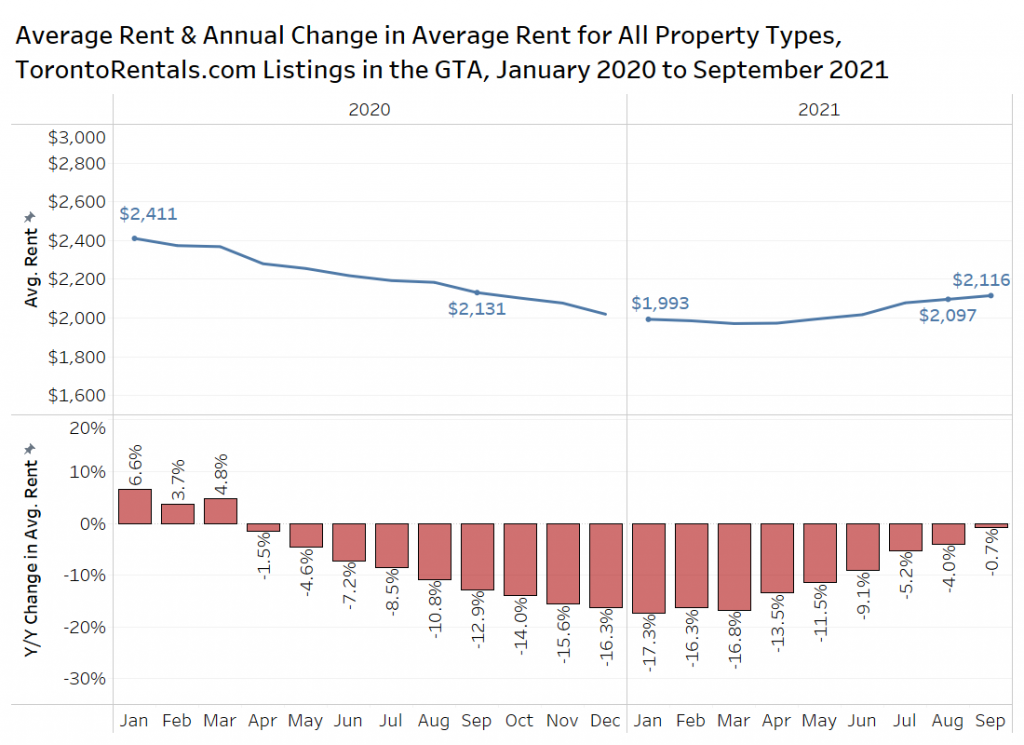
The average rent in the GTA continues to trend upward heading into the latter parts of 2021 based on listings data for all property types on TorontoRentals.com.
After hitting a two-year low of $1,971 in March 2021, the average rent has slowly increased to $2,116 in September 2021. The annual changes in average rent further enforces the idea that the average rental rates have bounced off a local low and are starting to recover. The average rent in September 2021 posted an annual change of -0.7% after being down by over 17% in January of this year.
Average Rental Rates by Bedroom Type
The average rent and annual change in average rent by bedroom type in the GTA from January 2021 to September 2021 is presented next. Five- and six-bedroom units have been removed from the chart, as the small sample size leads to monthly volatility.
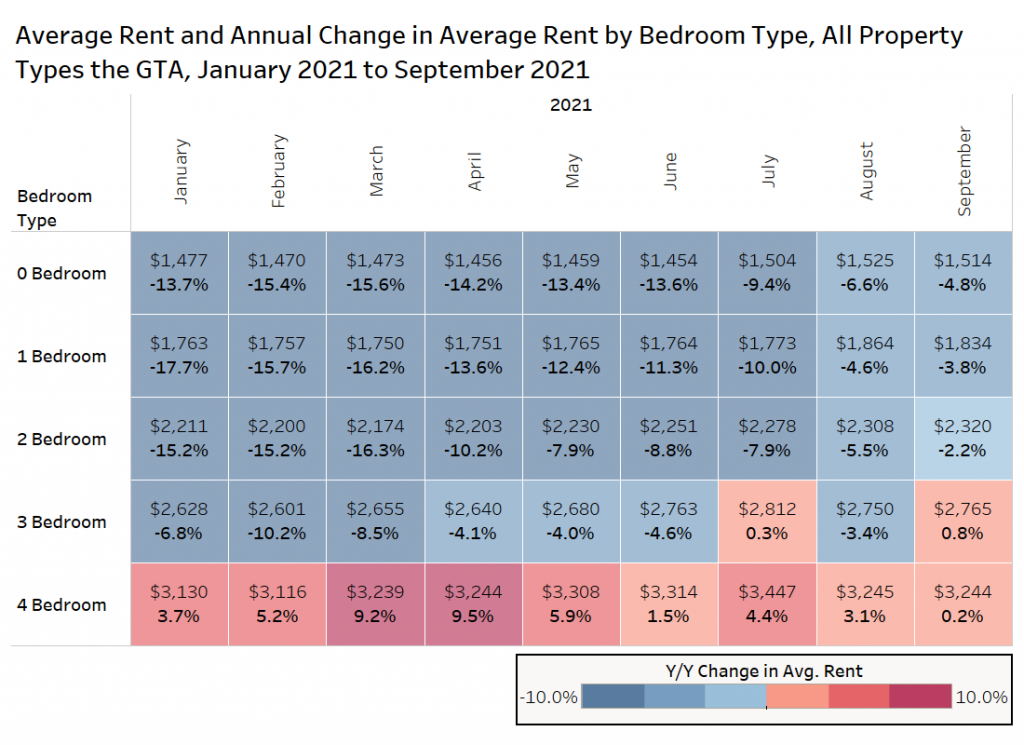 Studio units have seen their average rental rates produce consistent year-over-year declines between the months of January and September 2021. The largest annual decline was experienced in March 2021 at 15.6%. As mentioned above, the more recent months show signs of recovery as September 2021 only shows an annual decrease of 4.8%. Studios are about $45 more expensive than in February.
One-bedroom units followed a similar pattern, with January posting the highest annual decline in average rental rates at 17.7%, while September showed the lowest levels of annual decline at 3.8%. Two-bedroom units experienced the highest year-over-year declines in March 2021 at 16.3%, while experiencing lower levels of annual decline in September 2021 at 2.2%. A tenant will have to pay about $80 to $120 more for a one- or two-bedroom unit in comparison to the first couple of months of the year.
Three-bedroom units did not decline as harshly as their smaller counterparts, experiencing an annual decline in February 2021 at 10.2%, while showing an annual increase of 0.8% in September 2021. Four-bedroom units were the best performing segment of the market, posting annual increases in every month of 2021. The largest year-over-year increase was experienced in April 2021 at 9.5%. As documented in many previous reports, the desire for more space to work from home and educate from home, as well as a decoupling of employers and their place of employment made four-bedroom townhouse and single-family home attractive rental options during the pandemic.
Asking Rents for Condominium and Rental Apartments
The bar graph below presents data on the average asking rent for condominium apartments (orange) and rental apartments (purple), in the GTA (top panel) and former City of Toronto (bottom panel). As a reminder, this refers to the former City of Toronto or old Toronto, using the pre-amalgamation boundaries.
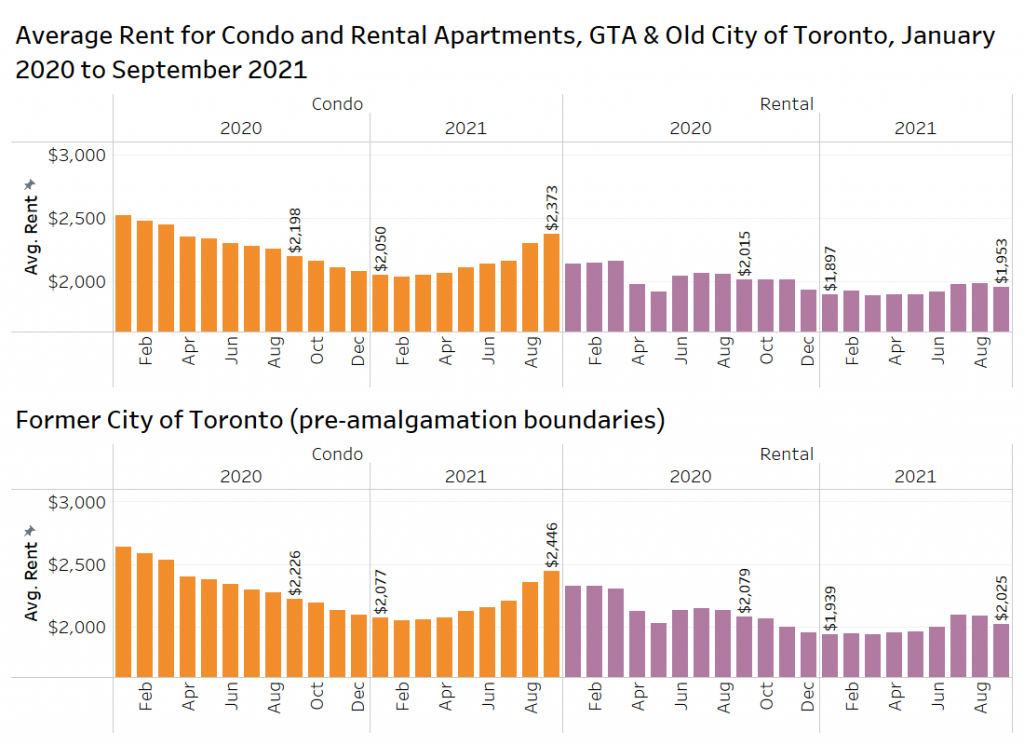 The average rent for a condo apartment in the GTA in September 2021 was $2,373 per month, which is an annual increase of 8% over the September 2020 average of $2,198 per month. The average rent for a rental apartment in September 2021 was $1,953 per month, which is an annual decrease of 3%.
The average rent for condo apartments in the GTA is 21% higher than the average rent for rental apartments in the GTA in September 2021, compared to 9% in September 2020.
In downtown Toronto, the average rent for a condo apartment was $2,446 per month in September 2021, while the average rent for a rental apartment was $2,025 per month. Similar to the rest of the GTA, the average rent for condo apartments are 21% higher than the average rents for rental apartments in downtown Toronto as of September of this year. In comparison, the average rent for condo apartments was 7% higher than the average rents for rental apartments in September 2020.
Rent Per Square Foot by Municipality & Former Municipality
The average rents per square foot for condo apartments in Downtown Toronto, Etobicoke, and Mississauga have experienced year-over-year increases, while the average rent per square foot in North York experienced an annual decline of 3.3%.
The average rents per square foot for rental apartments in Downtown Toronto and Etobicoke also experienced annual increases (4.5% & 11%), while rental apartments in North York and Mississauga experienced year-over-year declines (2% & 2.7%).
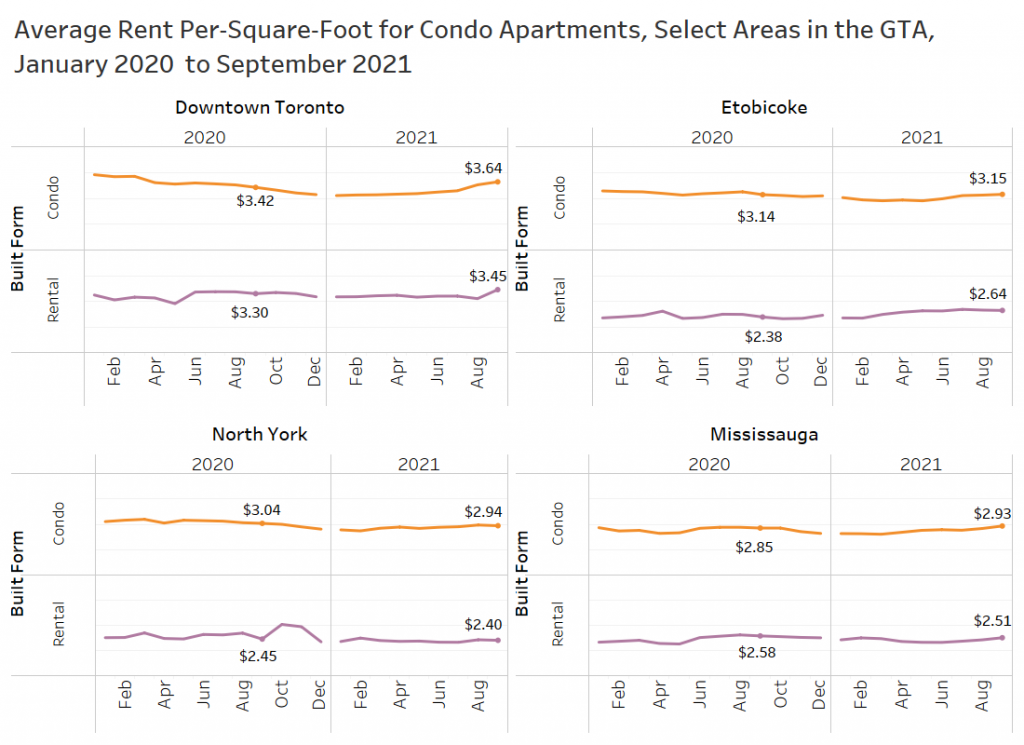
The rent premium for condo apartments over rental apartments is largest in North York at 22.5% with the lowest being Downtown Toronto at 5.5%. This is similar to a year earlier, where the premium for condo apartments over rental apartments was also the lowest in Downtown Toronto at 3.6%.
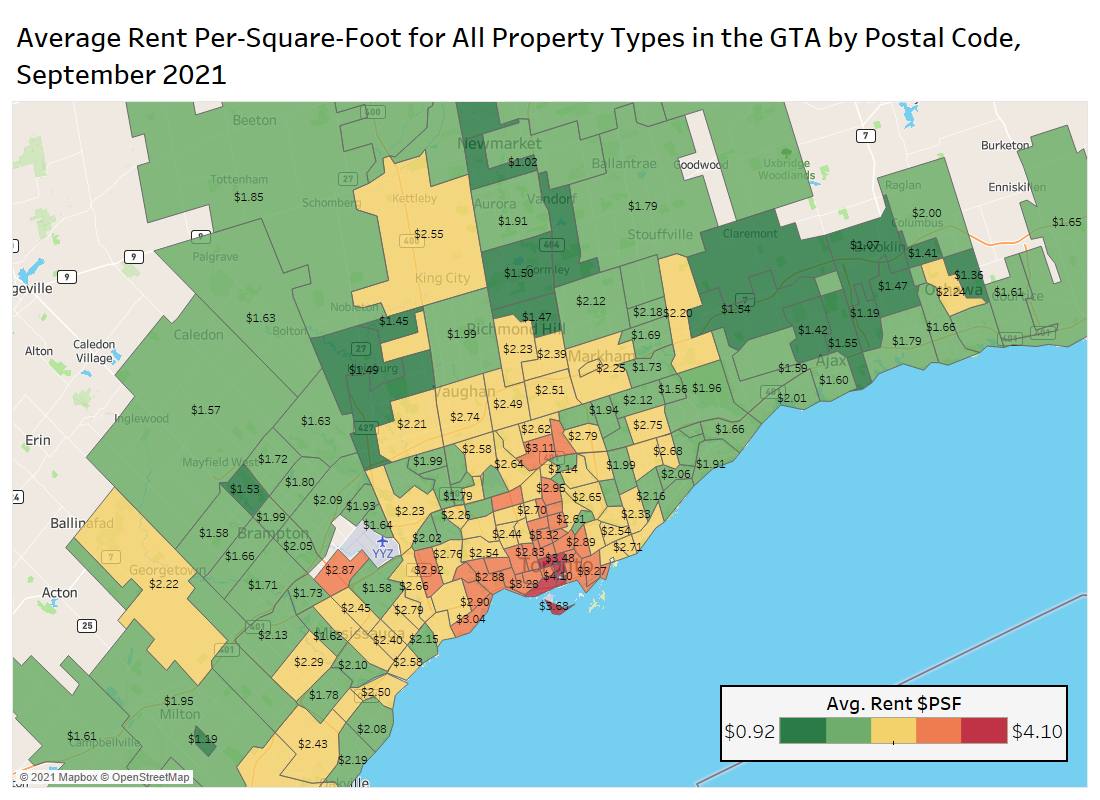
Average Rent Per Square Foot in the GTA by Postal Code

The following figure presents the average rent per square foot in postal codes across the GTA in September 2021. This chart includes all property types (singles, semis, row, condo & rental apartments, as well as basement apartments).
As expected, the postal codes with higher average rents per square foot (red) are mainly concentrated in the downtown Toronto area, while areas with lower average rents per square foot (green) are spread out in the surrounding suburbs.
The rents are heavily influenced by the type of product for rent, with many of the outer-suburban areas having only single-family homes for rent, while the downtown core is more dominated by new condos.
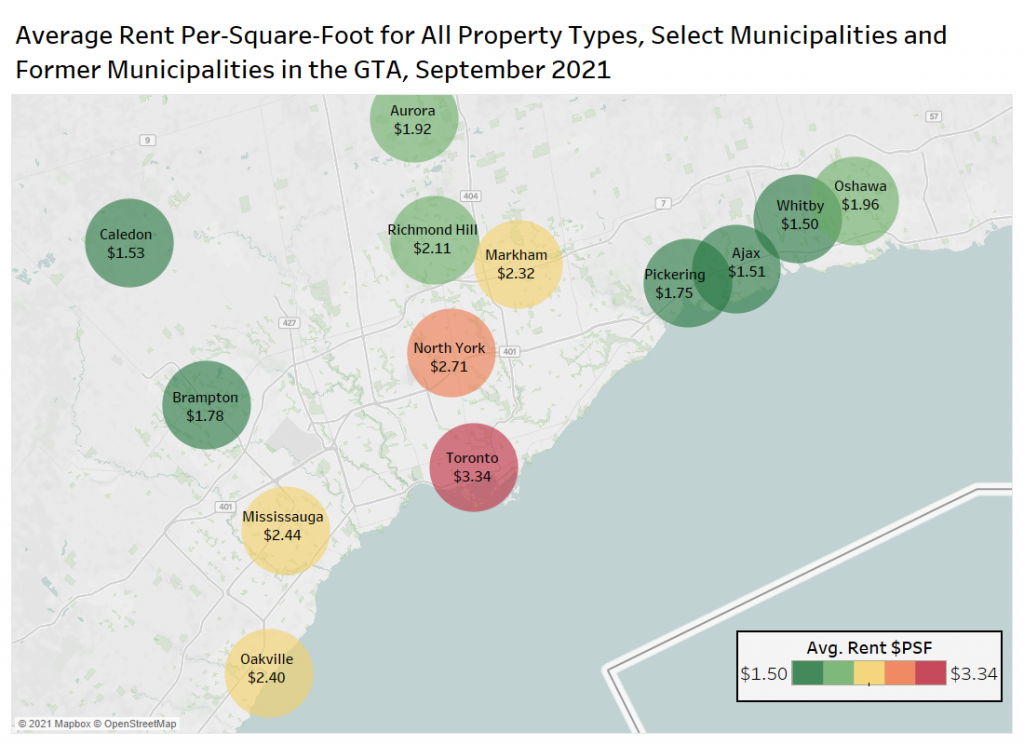
Average Rent Per Square Foot by Municipality
The figure below presents the average rent per square foot by area in the GTA (includes all property types). As mentioned above, the former City of Toronto area sports the highest average rent per square foot at $3.34. Many of the closer suburbs such as Oakville, Mississauga, North York, Markham, and Richmond Hill have average rents per square foot ranging from about $2.10 to $2.75. The suburbs farther away, such as Caledon, Whitby, Brampton, Aurora, Pickering, Oshawa and Ajax, have the lowest rents per square foot, ranging from about $1.50 to $2.
Average Rent by Built Form
The average rent in the GTA has gone through a roller coaster of a year, with basement apartments, rental apartments, condo units, and single-family homes all experiencing sharp declines at some point during the last two years.
Note that the sample sizes of basement apartments, townhouses and single-family properties are much smaller than rental or condo apartments on TorontoRentals.com and experience more monthly volatility, despite the chart below being a three-month moving average, which we use to smooth out some of the monthly movements to recognize a trend.
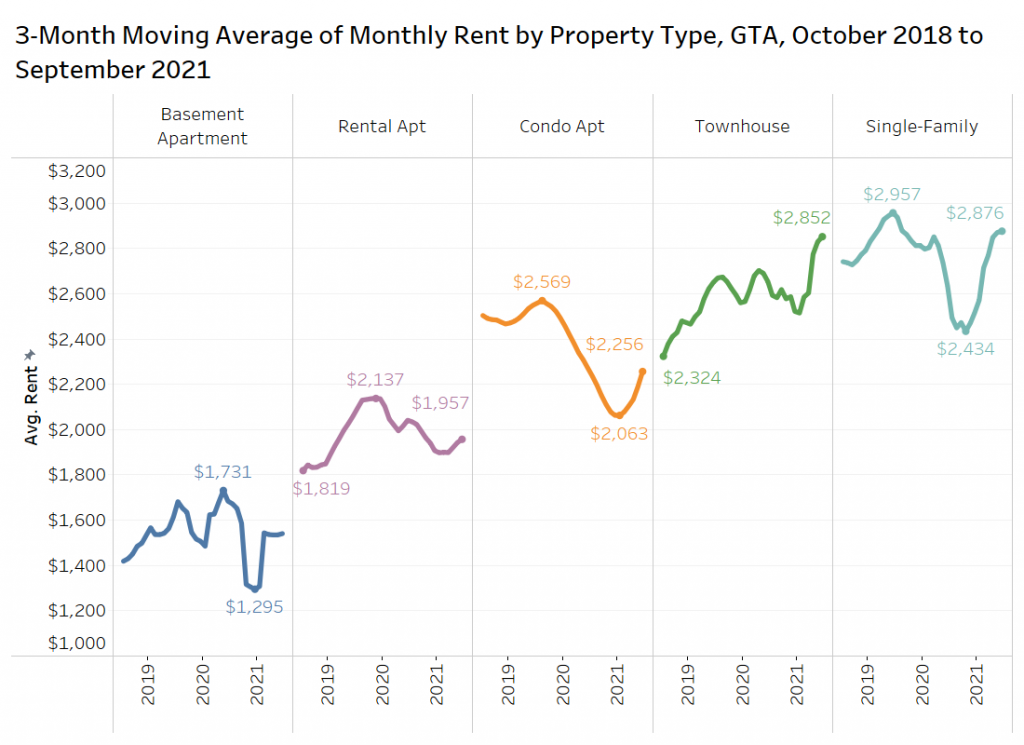
The average rent for purpose-built rental apartments, after peaking toward the end of 2019, steadily declined in 2020. Similarly, the average rent for condo apartments peaked in late 2019 before sharply declining in 2020. The recovery for condo apartments has been more sharp than the recovery in rental apartments.
Single-family homes behaved similarly to condo apartments — experiencing a sharp decline in average rental rates in 2020. The recovery for single-family homes was even more pronounced, as the average rent for single-family homes has almost recovered to mid 2019 levels. However, it should be noted that single-family homes could include a 1,300 single-family semi-detached on a lot that is 18 feet wide in Caledon, or a 4,000 square-foot home on a one-acre lot in Toronto, so the composition of listing can vary widely.
Townhouses in the GTA did not seem to be as affected by the pandemic as other market segments, with prices staying relatively stable in 2019 and 2020 before continuing to increase in 2021.
Average Rent by Area
The following figure presents the three-month moving average of average rents per square foot for the five areas (municipalities and former municipalities in the GTA) with the most listings between October 2018 and September 2021.
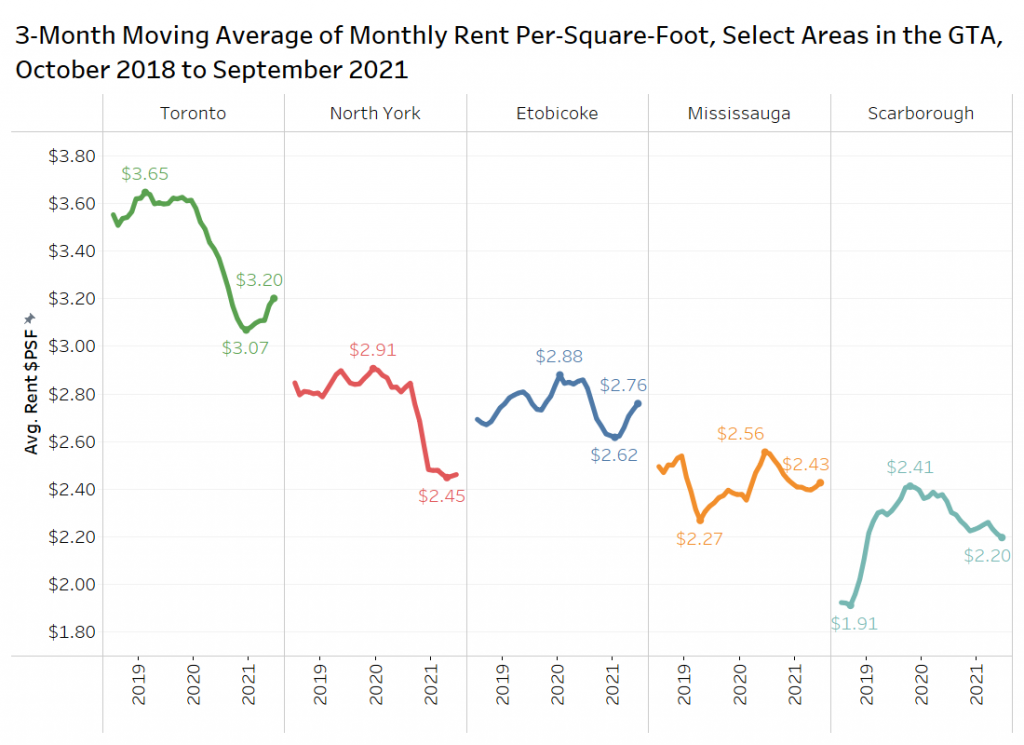
The average rent per square foot in Toronto and North York experienced the largest declines in 2020, while Etobicoke, Mississauga, and Scarborough experienced modest declines. Toronto and Etobicoke are the areas that have started a more noticeable recovery, while the average rents per square foot in North York and Scarborough remain soft.
In terms of declines from peak levels in 2019, the biggest decline is in North York at 16%. The municipality with September 2021 rent closest to its peak level is Etobicoke.
Average Rent Per Square Foot by Area and Unit Size
To no surprise, across most unit size segments Toronto maintained the highest average rent per square foot out of all the areas in the GTA between July 2021 and September 2021 — this is based on listings by rounded-unit size for select municipalities and former municipalities. This includes only listings from 450 square feet to 1,349 square feet.
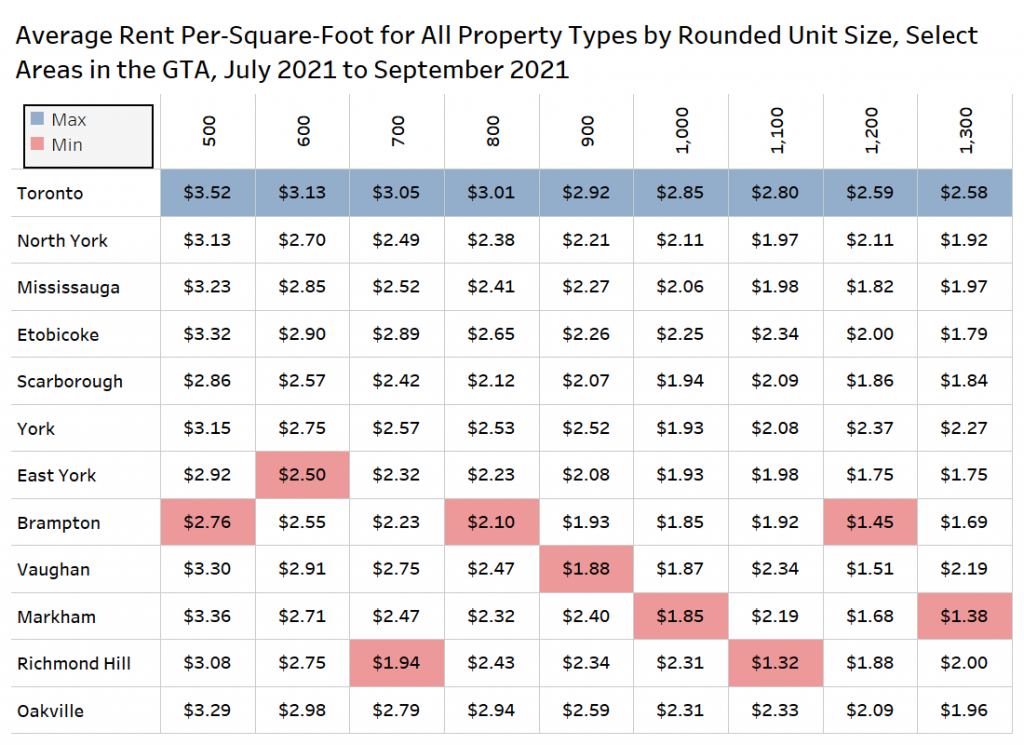
Notably, Brampton had the lowest average rent per square foot for units in the 500-square-foot range, as well as for units at 800 square feet and 1,200 square feet.
Conclusion
The average rent in the GTA has clearly shot up from lows in March 2020 and will look to continue its recovery heading toward the last quarter of 2021. Four-bedroom units were the best performing segment of the market — a result of the desire for more space as many employees continue to work from home for the foreseeable future.
During the pandemic, condo apartments experienced a larger decline in rental rates in the GTA, but have recovered stronger heading into September 2021. Rental apartments on the other hand, did not experience as drastic a decline, and have slowly increased heading toward the latter part of 2021. This is evident in the increasing difference in rental rates for condo apartments and rental apartments.
The past two years have been rough on all segments of the rental market with the exception of townhouses, which maintained a fairly steady rate since 2019 with sharp increases during the more recent months. Condo apartments, on the other hand, experienced a sharp decline throughout 2020 and have just started to recover. Single-family homes, similar to condo apartments, also experienced a sharp decline throughout 2020. The average rent for single family homes, however, have almost completely recovered to peak 2019 levels.
Toronto has maintained the highest average rent per square foot across all rounded-unit size segments, while also experiencing the steepest decline in average rents per square foot throughout the pandemic. North York also experienced a sharp decrease in 2020 that has yet to recover, while Etobicoke, Mississauga, and Scarborough have experienced comparatively lesser declines.
As the country continues its return to normalcy, rental rates continue to recover (condo apartments more quickly than rental apartments). Moving forward, average rents of larger units (namely townhouses and single-family homes) look to continue increasing as the demand for space to work from home persists.