Greater Toronto Area Rental Market
The following charts look at the summary data based on TorontoRentals.com residential rental listings in the Greater Toronto Area (GTA).
Monthly Asking Rent and Monthly Change in Rent for All Property Types
The chart below looks at the average rent for all property types by month since January 2019 (blue line – left axis), with the monthly change in average rent represented by the green bars. The data is sourced via TorontoRentals.com monthly listings.
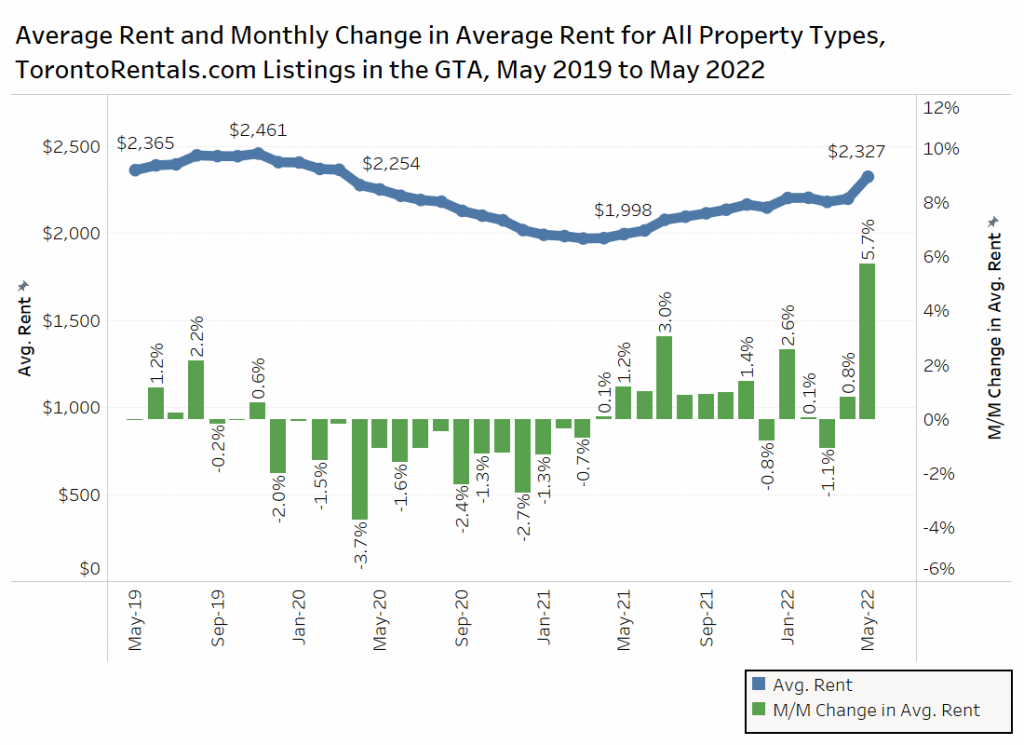
The average monthly rental rate continues to rise as the market recovers from the pandemic related declines in 2020 and 2021. The average monthly rental rate was $2,327 per month in May 2022, an annual increase of 16.5%.
Rental rates in May 2022 are about $45 less than the pre-pandemic rate of $2,372 in February 2020.
Average Rent and Annual Change in Average Rent by Property Type
The following figure presents the average monthly rent and the average rent per-square-foot for single-family homes, condominium apartments, and rental apartments in the GTA from May 2019 to May 2022. The rents marked are the last four May averages.
Single-family homes had an average monthly rental rate of $3,233 per month in May 2022, representing an annual increase of 12%. The average rent per-square-foot declined slightly year-over-year, moving from $1.78 to $1.73.
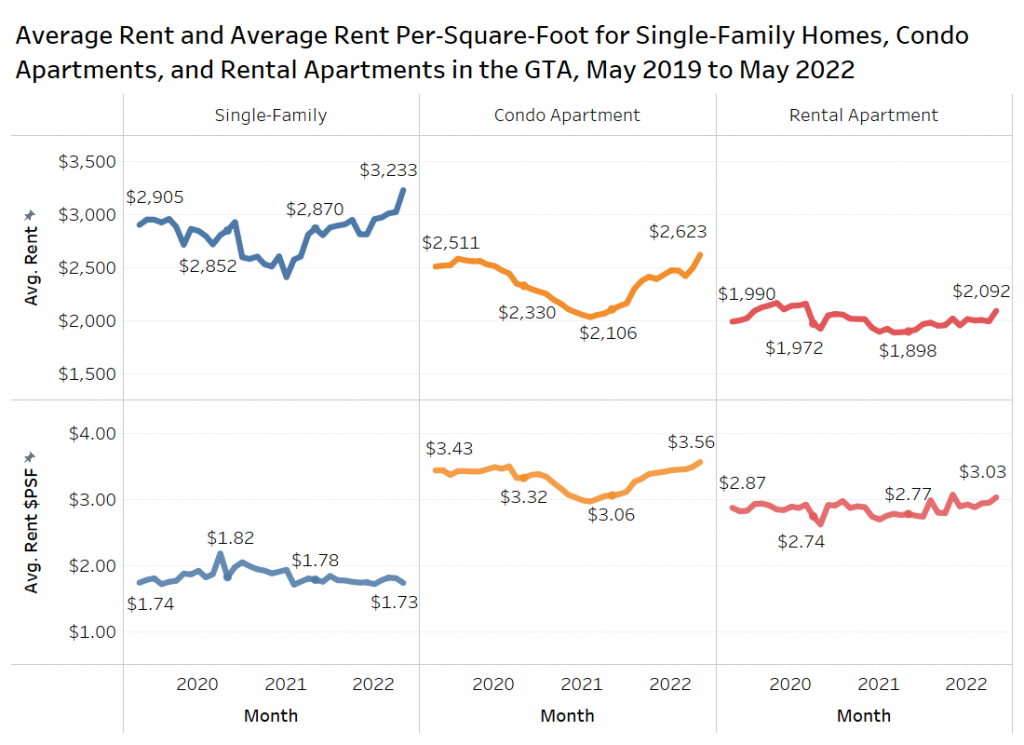
Condo apartments moved from $2,106 per month in May 2021 to $2,623 per month in May 2022 – an annual increase of 25%. The average rent per-square-foot has also increased significantly, moving from $3.06 to $3.56 (an annual increase of 16%).
Rental apartments have not increased as much compared to single-family homes and condo apartments, moving from $1,898 per month to $2,092 per month (an annual increase of 10%). The average rent per-square-foot for rental apartments has increased 9% year-over-year, moving from $2.77 to $3.03.
Average Rent, Annual Change in Average Rent, and Average Rent Per-Square-Foot by Bedroom Type
The figure below shows the average monthly rent, the annual change in average rent, and average rent per-square-foot by bedroom type for all property types in the GTA for April and May of 2021 and 2022
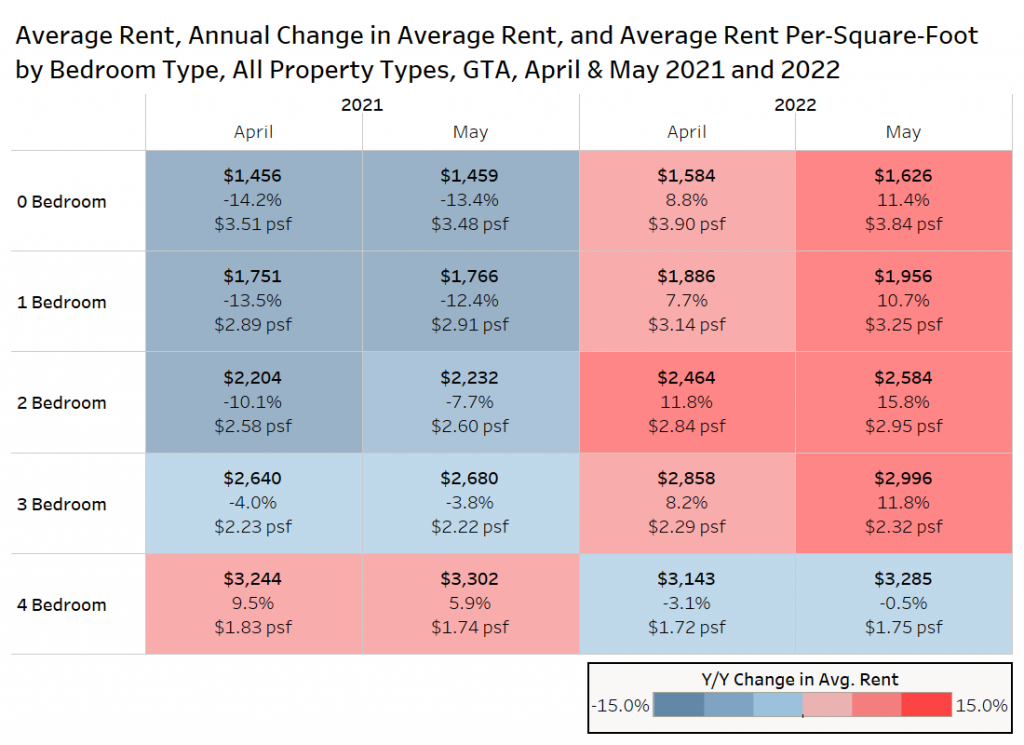
Two-bedroom units experienced the largest annual increase in average rent in May 2022, increasing by nearly 16% to $2,584 per month, with three-bedroom units rising by 12% annually to nearly $3,000 per month. Four-bedroom units were the only bedroom type to experience an annual decline in average rent, decreasing by 1% year over year to $3,285 per month.
Average Rent by Rounded-Unit Size
The figure below presents the average rent per-square-foot and the annual change in average rent per-square-foot for condo and rental apartments in April and May of 2021 and 2022 by rounded-unit size (rounded to the nearest hundred for units from 250 square feet to 1,149 square feet).
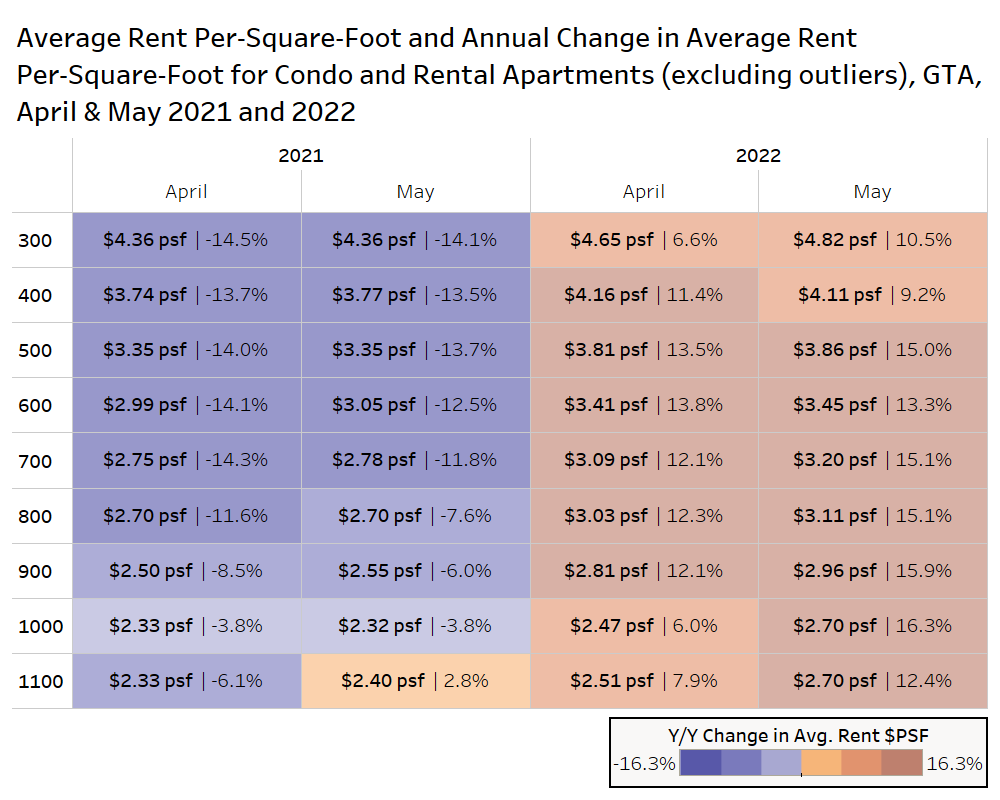
In May 2022, all of the rounded-unit sizes in this square foot range experienced an annual increase in average per-square-foot rents from a low of 9% to a high of 16%. The majority of the units from 500 square feet to 1,000 square feet grew by about 15% annually, with slightly lower growth for the 300, 400 and 1,100 square foot units.
In general, it appears that in April and May 2021, the smaller units experienced the biggest declines while the larger units experienced much more modest declines as tenants looked for more space to work from home.
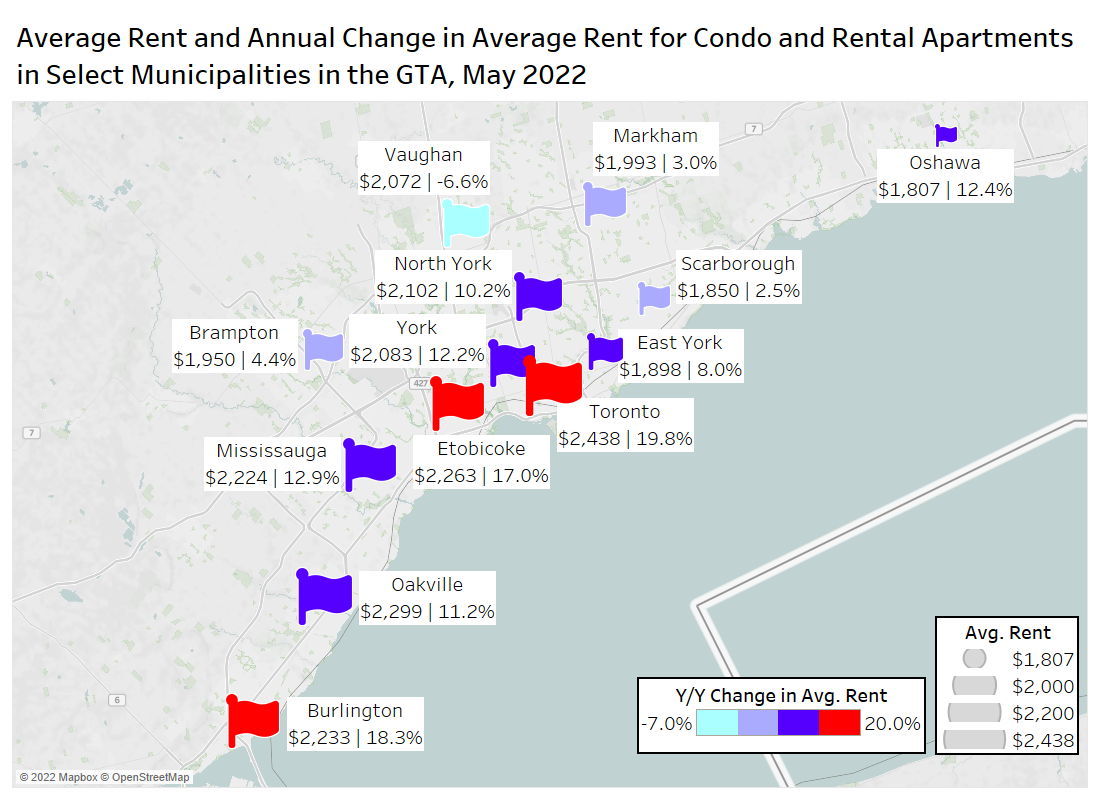
Average Rent by Municipality
The figure below presents the average rent and the annual change in average rent for condo and rental apartments in select municipalities (and former municipalities pre-amalgamation) in the GTA in May 2022.
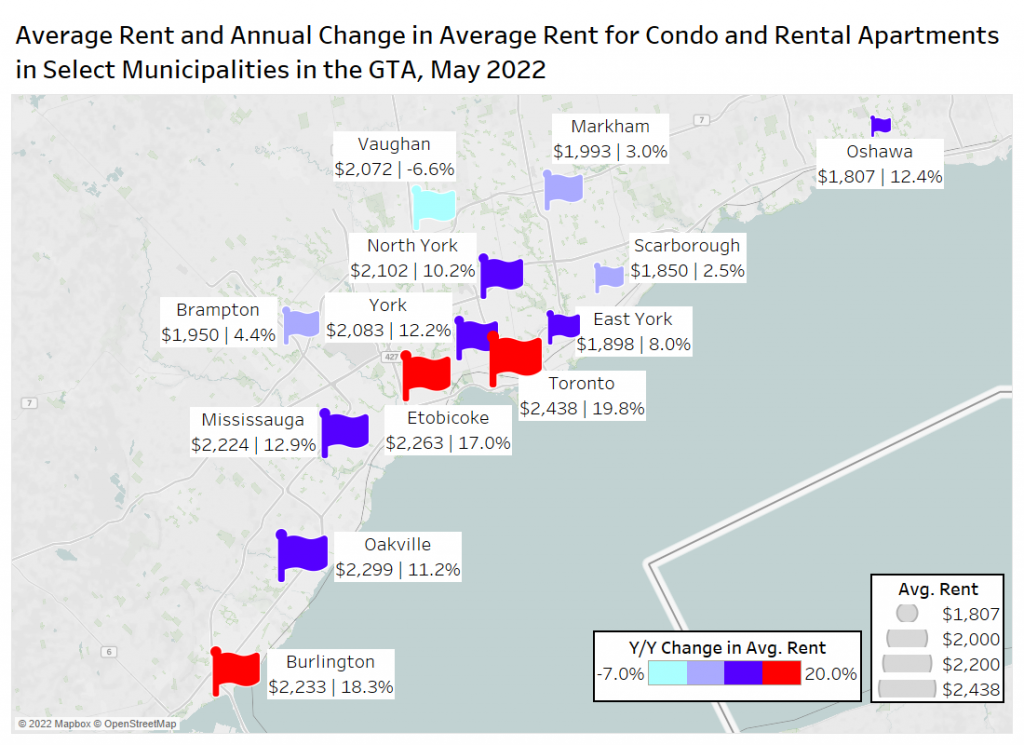
Toronto had the highest average monthly rental rate at $2,438, with an annual increase of 19.8%. Etobicoke and Mississauga followed closely, with average monthly rental rates of $2,263 and $2,224 per month respectively, with year-over-year increases of 17% and 13% over May of last year.
Vaughan is the only municipality that experienced an annual decline in average rent, decreasing by 6.6% to $2,072 per month.
Average Rent by Neighbourhood
The next chart looks at the average rent for the most active neighbourhoods in the GTA, looking at 2019, 2020 and 2021 in comparison to January to May 2022.
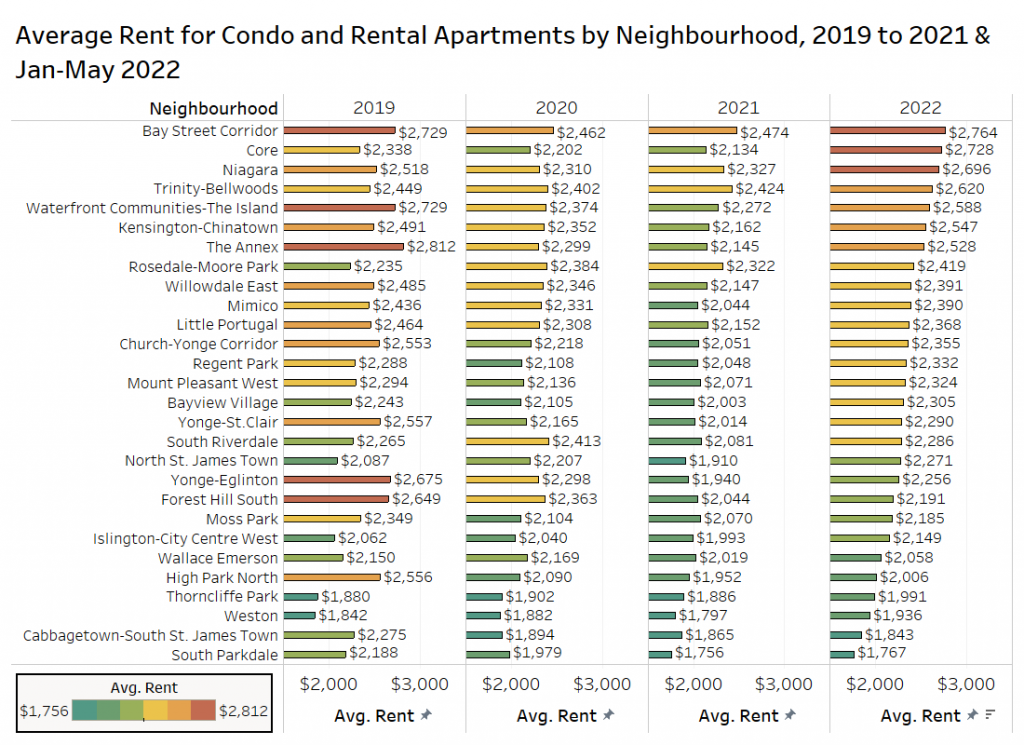
The highest rents in the GTA in 2022 (January to May only) is in the Bay Street Corridor at $2,764 per month, an increase of 12% over 2021 overall, and 1% over 2019, the year in which rents previously peaked.
The highest rent growth has occurred in Mississauga’s Core neighbourhood (often referred to as the Mississauga City Centre), with rent for condo and rental apartments up 28% annually to $2,728 per month. Core rents are 17% higher than 2019.
Other areas with annual rent growth of 16% to 19% include North St James Town, Kensington-Chinatown, The Annex, Mimico and Niagara.
The only market where rents are lower than last year is Cabbagetown, however this appears to be a big shift in the average listing, with last year’s average unit size being 742 square feet, dropping to 586 this year. Parkdale rents in 2022 are still way below the 2019 peak (-19%), but the average unit size is also smaller when comparing listings in the two periods (695 square feet versus 611 square feet).
Average Rent in Select Toronto Neighbourhoods
The figure below presents the average monthly rental rate per-square-foot for condo and rental apartments in select neighbourhoods in Toronto between May 2019 and May 2022. The data marked includes the minimum and maximum values, as well as the May 2022 rent level.
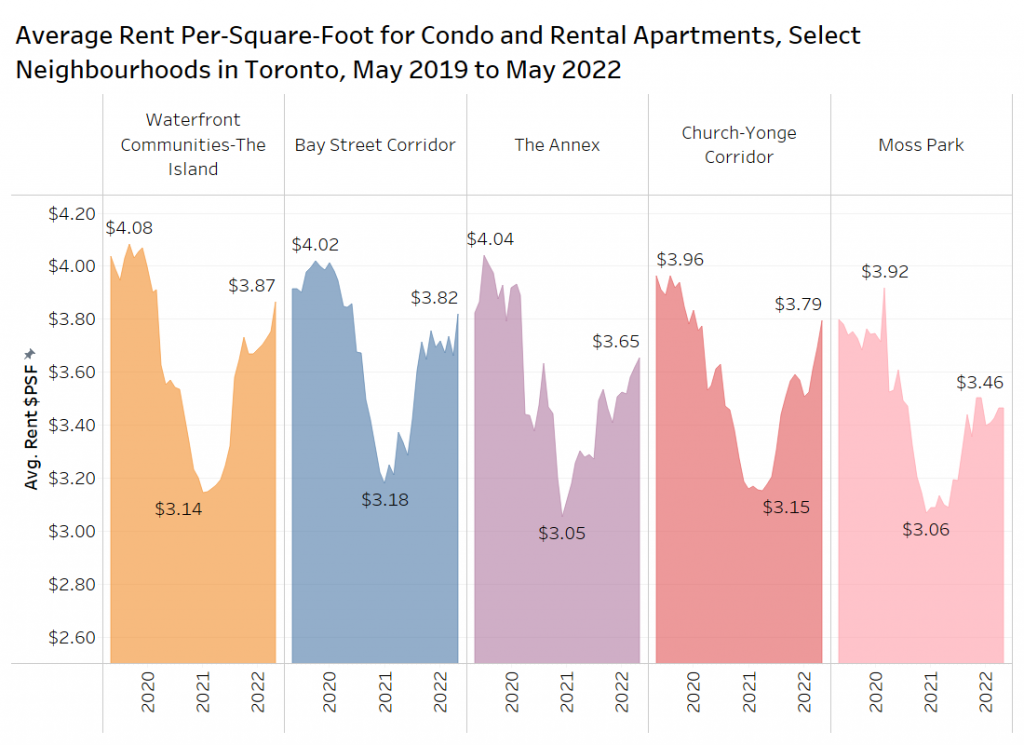
None of the five neighbourhoods mentioned above topped their peak rental rates as of May 2022. In the Waterfront Communities-The Island neighbourhood, rents declined by 23% from September 2019 to January 2021, but have since increased by 23%. However, rents are 5% below the peak level. In the Bay Street Corridor, per-foot rents peaked at $4.02 on average before falling to $3.18 per square foot (-21%), but have since increased by 20% and also remain about 5% below the peak rent levels. Annex rents fell 25% from their peak, moving back up 20% but remaining 11% below the peak in May at $3.65 per square foot on average. Church-Yonge rents dropped 20% and then increased 20%, but are 4% below the peak in May of this year at $3.79 per square foot. The Moss Park area saw rents peak at $3.92 per square foot in March 2020, before the pandemic pushed rents down, falling to $3.06 in December of 2020. Rents have gone up 13% since but are 12% below that 2020 peak level.
Average Unit Size and Average Rent Per-Square-Foot at Select Condo Projects
The figure below presents the average unit size and the average rent per-square-foot at TorontoRentals.com listings for select condo apartment projects in the GTA with at least 20 listings in 2021 and 2022.
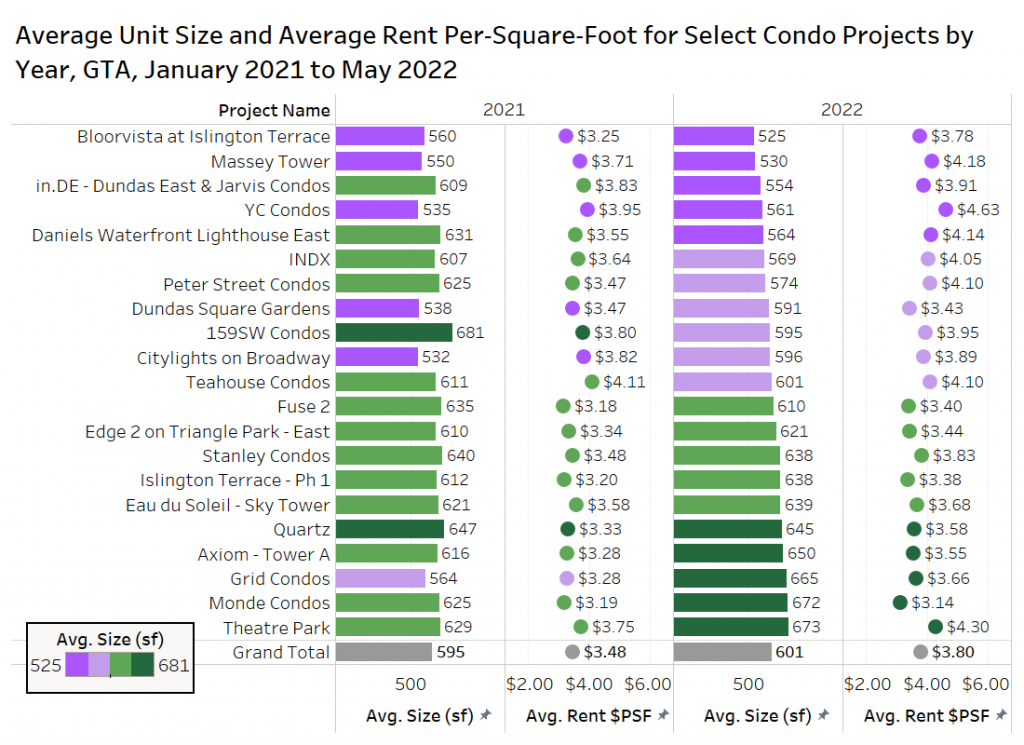
Bloorvista at Islington Terrace in Etobicoke had the lowest average unit size for listings at 525 square feet, with average rent of $3.78 per square foot, up 16% over 2021.
Massey Tower has an average unit size of 530 square feet based on the 2022 listings data, with rent of $4.18 per square foot, up 13% over the 2021 total.
Breakdown of Listings and Average Rent at Newly Completed Condo Projects
The chart below looks at rental data for condominium apartment projects completed between the start of 2020 to the first half of 2022. The market share by size range and bedroom type is shown, as well as the average rent for that size range (100 square foot bins or square foot ranges).
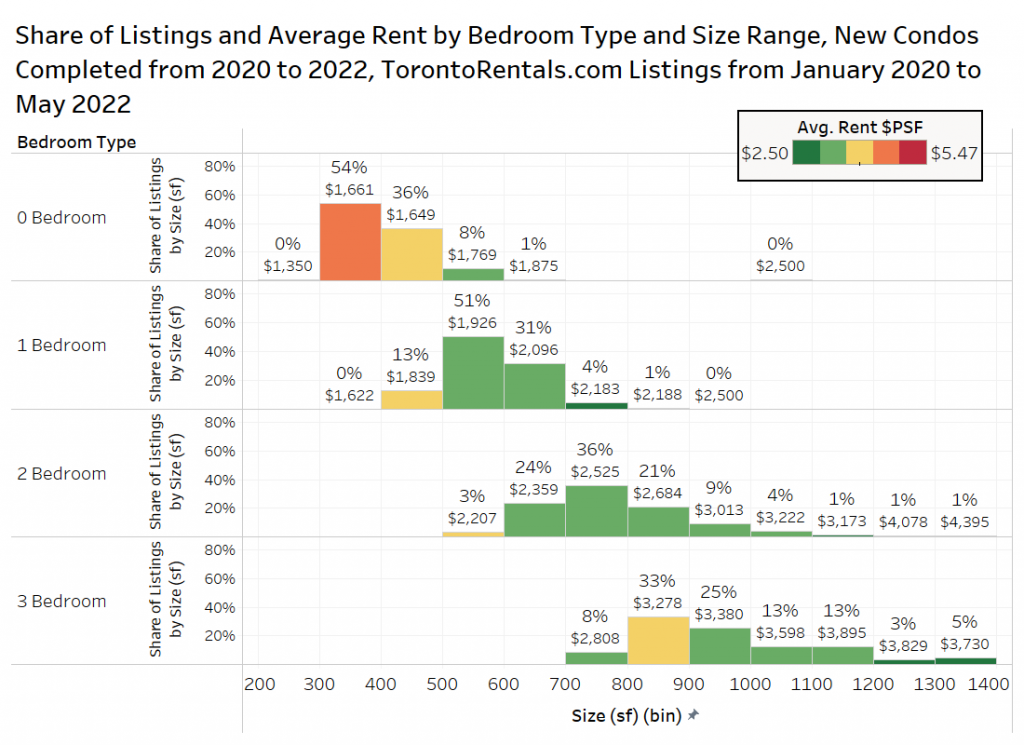
54% of the new studio condos range from 300 square feet to 400 square feet, and are offered at $1,661 per month on average.
51% of one-bedroom units in these newly completed condo projects range from 500 square feet to 600 square feet, and are offered for rent at just under $1,930 per month.
36% of two-bedroom units range from 700 square feet to 800 square feet in these condos completed over the last 2.5 years, with an average rent of $2,525 per month.
33% of the three-bedroom unit range from 800 square feet to 900 square feet, with average rent of $3,278 per month.
Conclusion
The average monthly rental rate continues to rise as the COVID-19 pandemic-related declines of 2020 and 2021 become a thing of the past. The average rent in the GTA was $2,327 per month, up by almost 17% annually, and 6% monthly, but still below rent levels from three years ago (May 2019: $2,365).
However, a change in the composition of listings on TorontoRentals.com is contributing to rents being lower in 2022 versus 2019, as single-family homes, condo apartments and rental apartments have higher rents in May 2022 than May 2019.
With the growing number of super-small condos hitting the market, rental rates are not growing as fast in this size range, with units from 700 square feet to 1,000 square feet growing at a clip of about 15% to 16% annually.
Of the major municipalities in the GTA, the former City of Toronto (pre-amalgamation boundaries) is growing the fastest with nearly 20% annual growth. The most desirable neighbourhoods pre-pandemic (most centrally located) are experiencing the highest growth in 2022 at 15% to 20% annually, whereas the less desirable or “outer-416” communities are seeing more modest annual rent inflation at 5% to 10%.
In a quest to fight off inflation, central banks across the world are increasing interest rates, and as a consequence, in the GTA, resale house prices are softening. In the short-term that is dissuading some would-be buyers from exiting the rental market, reducing rental supply (listings have fallen 22% from November 2021 to May 2022 on TorontoRentals.com, and 10% since the resale market peak in February of this year). This reduced supply coupled with increased demand via immigration, more students, and recent graduates moving out of their parents homes have contributed to the rapid rise in rental rates.
However, it should be noted that the higher rates could push the country into a recession, and flattening out of resale prices could entice some of those prospective buyers to try to time the bottom of the housing market and leave the rental market. Some investors/landlords will sell their rental properties due to a housing slump, potentially reducing rental supply. It is too early to determine which of these factors will have a bigger impact on the rental market.
Other factors including a bump in tourism due to changing border policies could result in rental units added to the short-term rental market, or supply-chain issues and labour stoppages slowing down the pace of new housing completions. Both these factors could reduce rental supply.
Bullpen and TorontoRentals.com will continue to monitor the conditions in the rental market, and report on them monthly in this blog.