Average Rent in the GTA
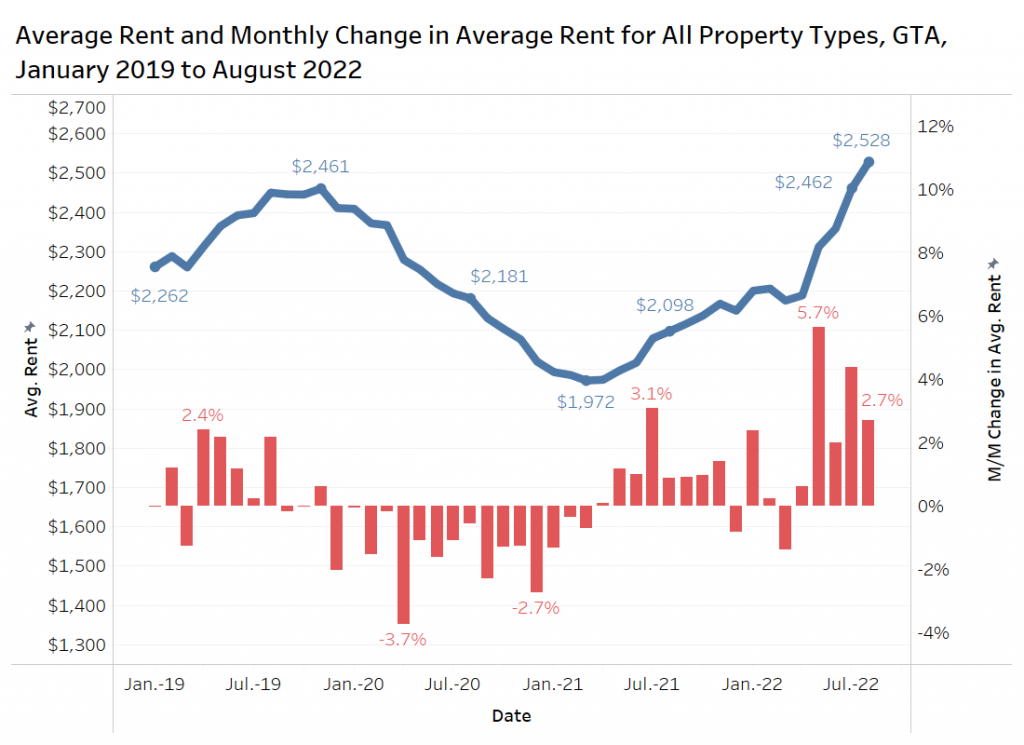
The average rent for all property types in the Greater Toronto Area (GTA) trended downward throughout pandemic-impacted 2020, with monthly declines as large as 3.7%. The TorontoRentals.com listings data summarized in this report include single-family homes, townhouses, condominium apartments, rental apartments, and basement apartments.
In April 2021, when rent hit a low of $1,972 per month, the trend reversed, and rental rates began increasing. In August 2021, the average rental rate in the GTA was $2,098 per month (refer to the chart below, which shows the average rent in blue and the monthly changes via the red bars).
In August 2022, the average rent was up 2.7% month over month and 21% annually to $2,528 per month. GTA rents have increased by 2% or more in each of the last four months after reaching a multi-year high of 5.7% in May.
.
Average Rent by Number of Bedrooms
The chart below looks at the average rent by bedroom type for all property types in the GTA from August 2019 to August 2022. The highest and lowest rent levels are marked for these four categories, as well as the August 2021 and August 2022 rent levels.
Studio units have increased by 22% from their lowest level over the last three years $1,454 to $1,771 per month on average in August 2022. During the same time period, one-bedroom units increased by 19.6% from a 2021 low of $1,750 to $2,093 in August, while two-bedroom units increased a sizable 26.3% from their 2021 low of $2,175 to $2,746.
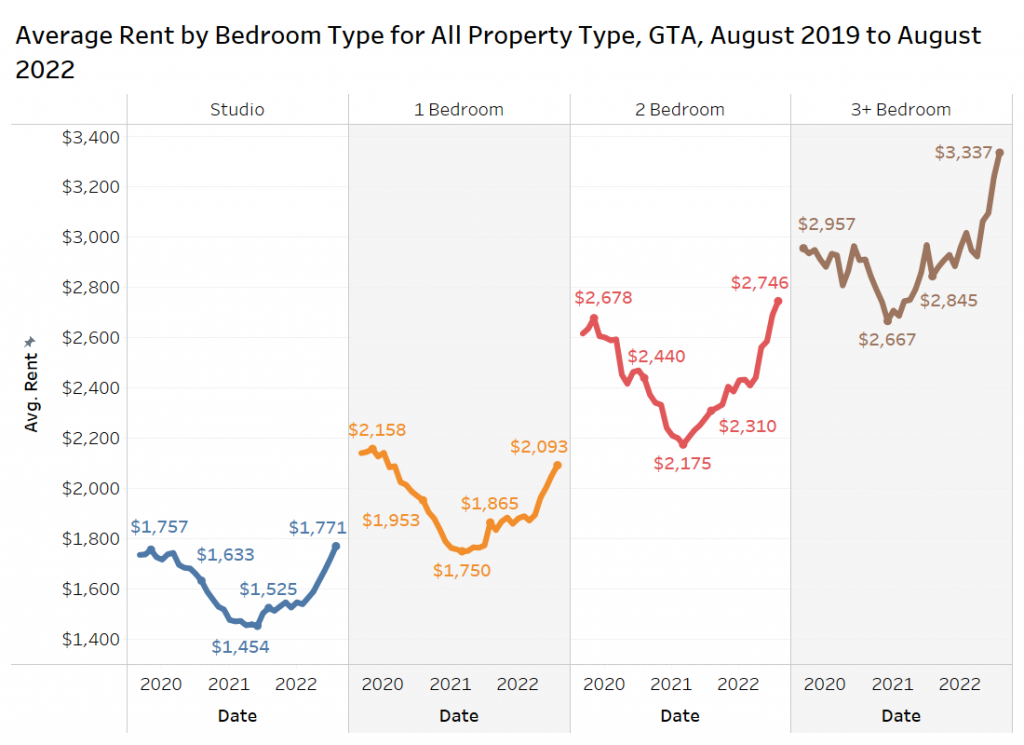
The last category looks at three-bedroom or larger units, which dropped by nearly $300 a month from late 2019 to early 2021 before rebounding sharply to $3,337 per month in August 2022, a jump of over 25% from the pandemic-induced low of $2,667 per month.
Average Rent Per Square Foot by Property Type and Bedroom Type
The following chart looks at the average rent by property type and bedroom type in the GTA, with the annual change in the average rent level also shown. Categories with less than 50 listings were eliminated, as were five- and six-bedroom properties.
Condo apartments had the highest annual growth by property type, with a 16% year-over-year increase ($2,653). Both one- and two-bedroom condo apartments increased by 14% since August 2021. The composition of the listings has shifted year to year, as none of the individual bedroom types topped the cumulative 16% growth rate for condos.
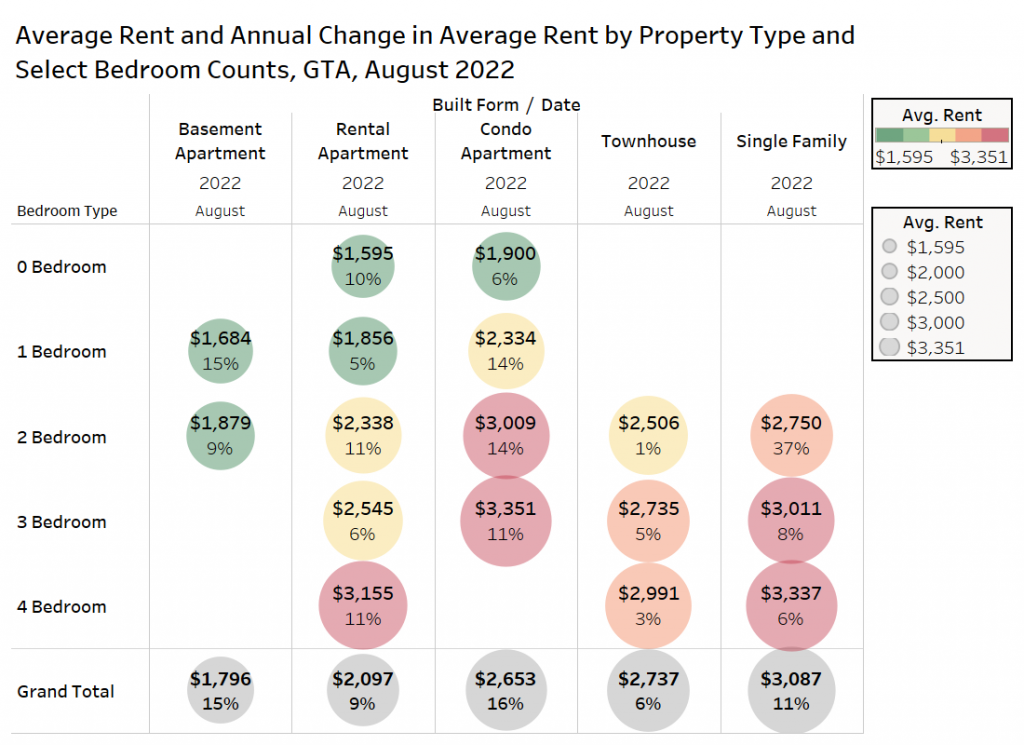
Two-bedroom single-family homes showed rent increases at an eye-catching 37% annually to $2,750. However, the sample size was relatively small.
Both two-bedroom and four-bedroom apartment rentals increased by 11% annually, followed by studios at 10%.
Average Rent by Area in the GTA
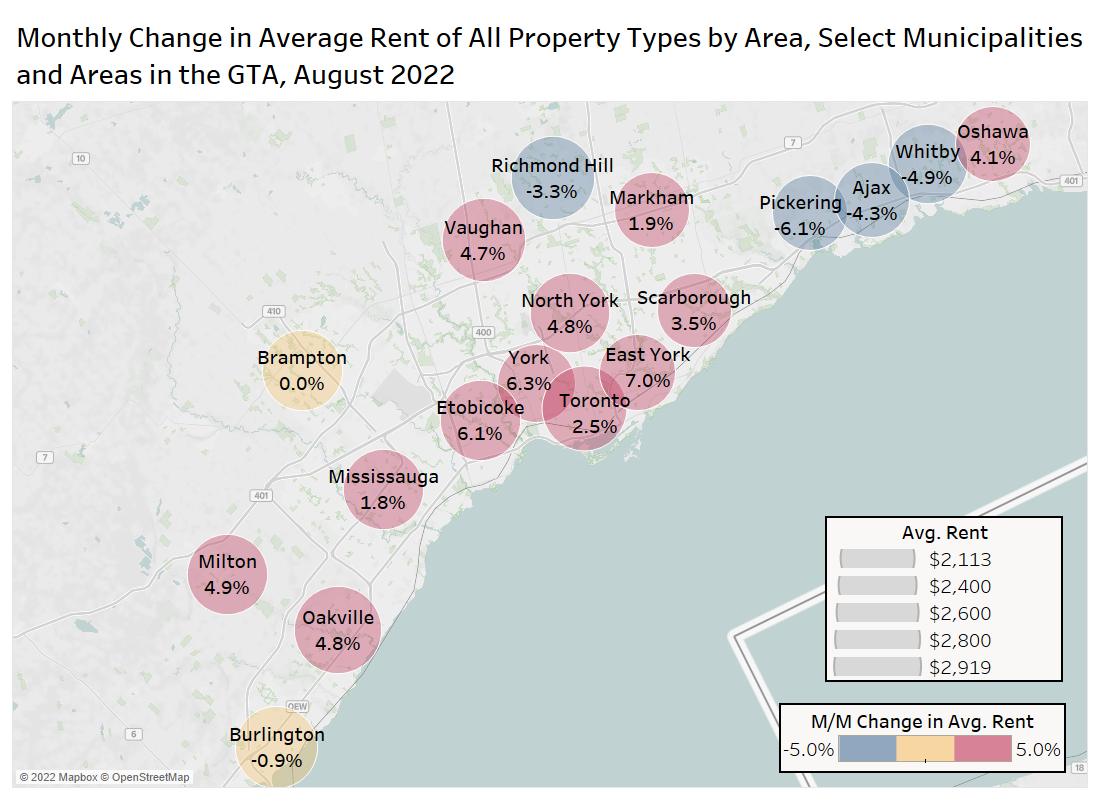
The map below shows the change in average rent in August 2022 compared to July 2022 for a select number of GTA municipalities, and the former municipalities in the City of Toronto. The data covers all property types.
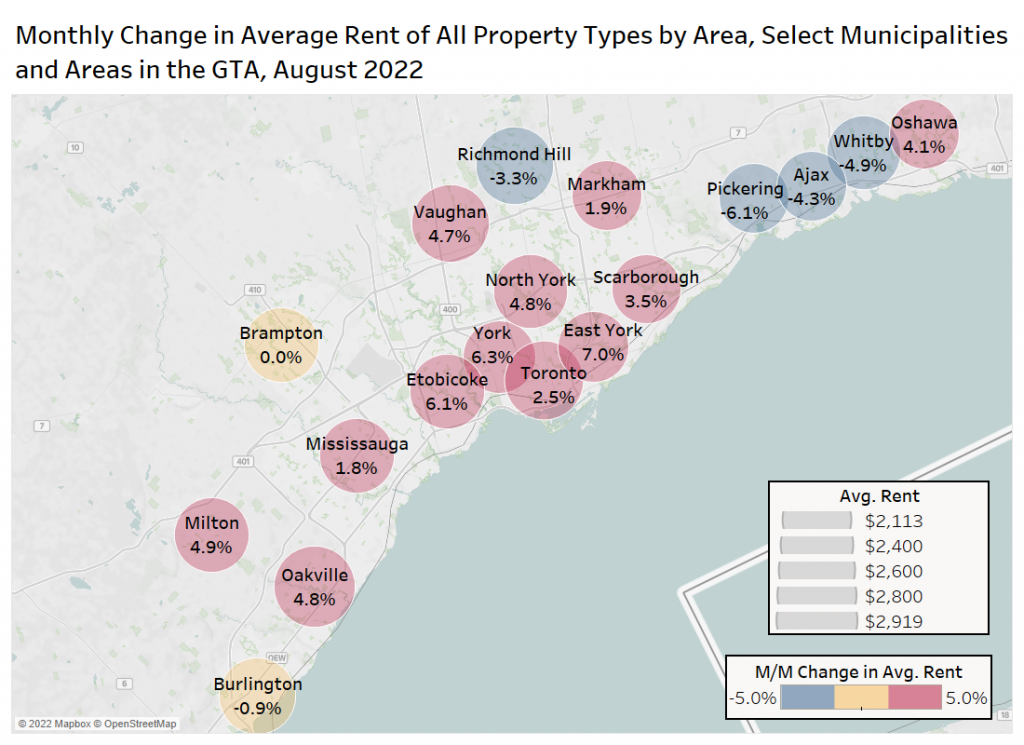
The majority of the areas in the GTA experienced monthly increases in average rent in August 2022 compared to July of this year. Several of the smaller cities represented in the map experienced outsized gains or declines, which could partly be due to a changing sample of listings.
The areas with the most significant monthly gains include East York (7.0%), York (6.3%) and Etobicoke (6.1%).
Three municipalities in Durham Region experienced substantial declines. Pickering had the most significant reduction (-6.1%), while Whitby (-4.9%) and Ajax (-4.3%) also saw a decrease. Outside of Durham, Richmond Hill also saw a -3.3% reduction.
Average Rent for Condominium Apartments by Municipality and Area
Condominium apartment rents were hit the hardest during the pandemic, especially in the urban areas. The figure below looks at the average asking rent for condominium apartments in Mississauga and four former pre-amalgamation cities of Etobicoke, North York, Scarborough and Toronto. The August 2019 and August 2022 rent levels are shown.
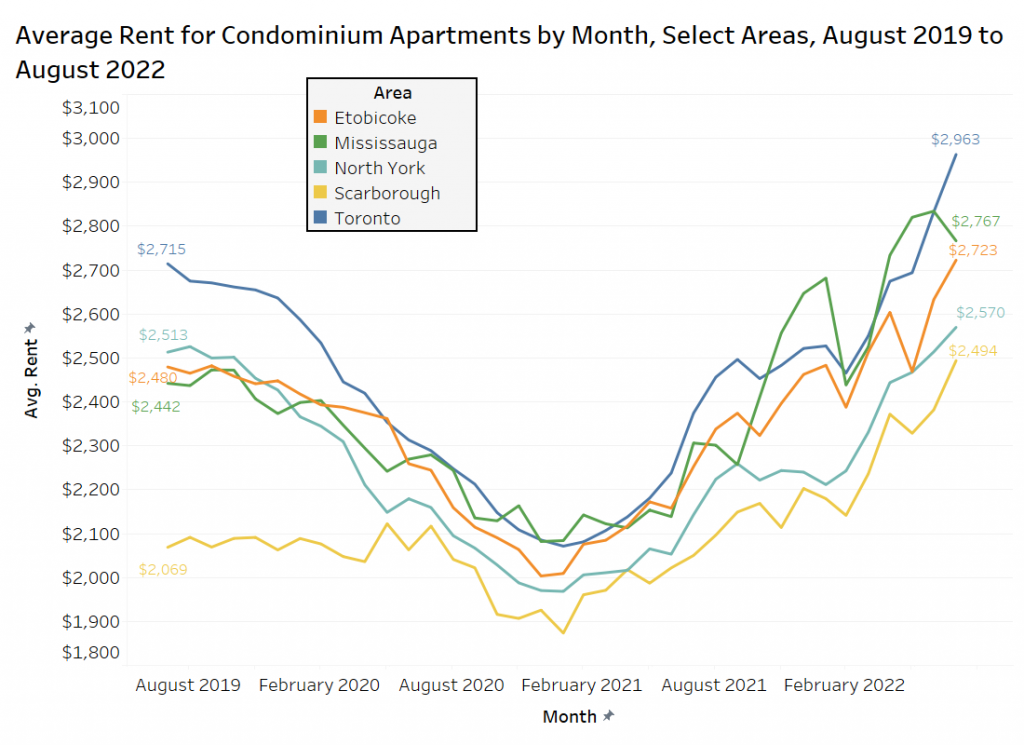
In Old Toronto in August 2022, landlords and owners were asking $2,963 per month for the average condo for lease, compared to $2,715 in August 2019, an increase of 9.1%. This increase comes after a steep Covid-related decrease in rent that, at its lowest, saw rents below $2,100 per month in 2021 – condo rents are up 43% since.
In August 2019, Mississauga had lower condo rents in comparison to Etobicoke and North York. However, the municipality has recently experienced stronger growth, rising to $2,767 per month in August of this year, an increase of 13.3% compared to three years earlier. Mississauga’s pandemic rent decrease was not as steep as Toronto’s, where the average rent dropped 14.4% in February 2021 compared to a more considerable drop of 23.4% in Toronto.
Scarborough saw a 20.5% increase overall in monthly rent from $2,069 in August 2019 to $2,494 in August 2022. Covid impacted this area far less than Toronto and Mississauga, only seeing a 9.5% rent reduction during the same period.
Average Rents by Quarter for Rental Apartments in Select Areas
The table below shows the average rent for the five high-activity areas in the GTA by quarter from Q4-2018 to Q3-2022 (the third quarter of this year includes July and August only).
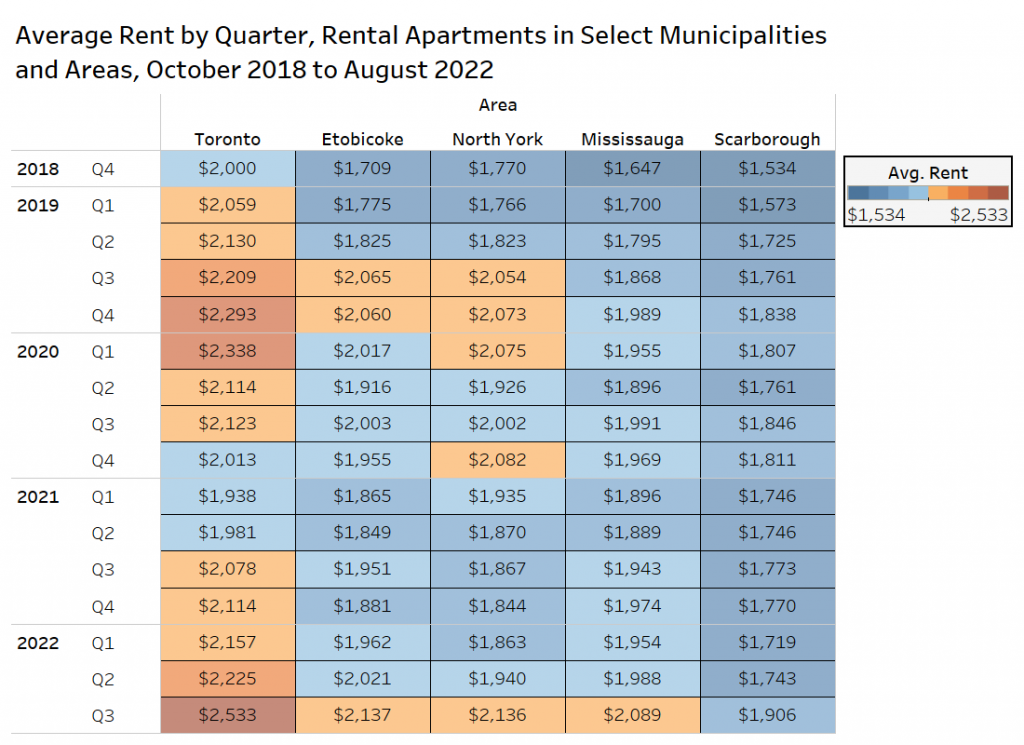
In the city of Toronto, rents for traditional apartments increased in each quarter in 2019, trended downward during pandemic-impacted 2020, and have trended upward since. From a low of $1,938 per month in Q1-2021 to $2,533 per month in the third quarter of 2022, rents increased nearly $600 or 30.7% since the early months of last year. The quarterly increase in Q3-2022 was a whopping 13.8%.
All of the other municipalities experienced significant quarterly rent increases in Q3-2022 as well. Between Q2 2022 to Q3 2022, Etobicoke saw an increase of 5.7%, North York grew by 10.1%, Mississauga jumped 5.1%, and Scarborough was up 9.4%.
Average Rent by Neighbourhood and Bedroom Type
The chart below shows the average rent by bedroom type for all property types for select neighbourhoods in the GTA during the first eight months of 2022.
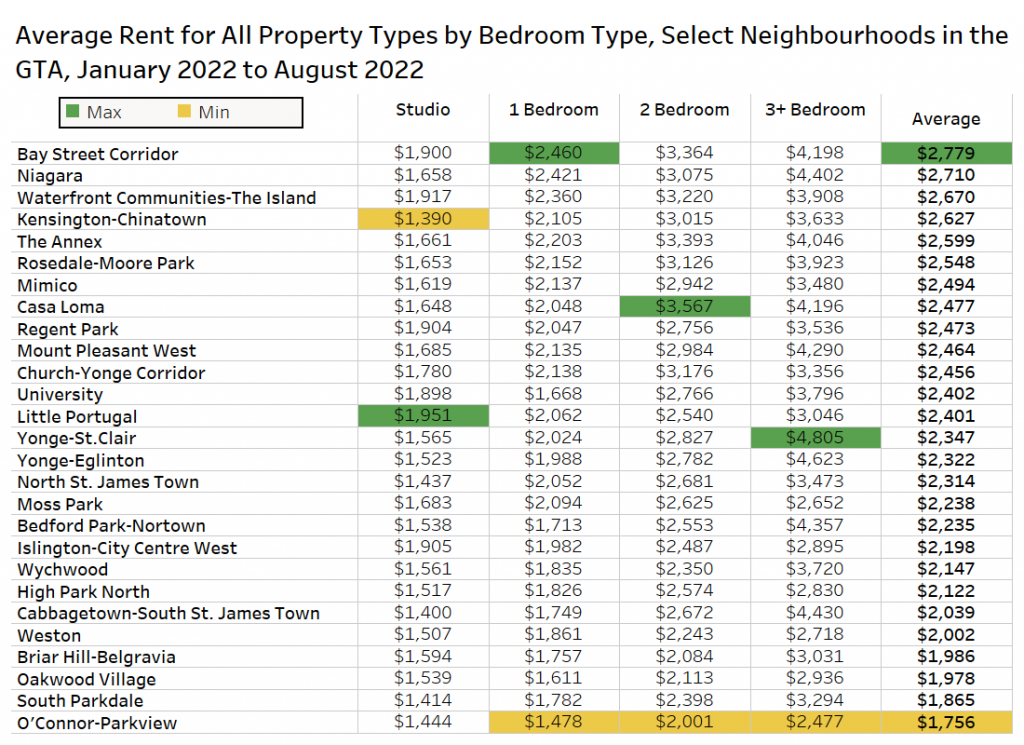
The area with the highest rents for each property type are:
- Studio – Little Portugal $1,951
- 1 bedroom – Bay Street Corridor $2,460
- 2 bedroom Casa Loma – $3,567
- 3+ bedroom – Yonge – St.Clair $4,805
The highest average across all property types is the Bay Street Corridor at $2779.
The least expensive rents by property types are:
- Studios – Kensington – Chinatown $1,390
- 1 bedroom – O’Connor – Parkview $1,478
- 2 bedrooms – O’Connor – Parkview $2,001
- 3 bedrooms – O’Connor – Parkview $2477
It costs about $1,000 less per month to rent in the O’Connor-Parkview neighbourhood (west of Victoria Park, south of Eglinton, and north of Taylor Creek in the East York area) than in the Bay Street Corridor (south of Yonge Street).
Average Rent by Neighbourhood – Condo Apartments
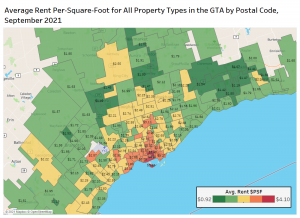
The chart below shows the average rent per-square-foot for three of the most active Toronto neighbourhoods over the past three years. Rents are marked above the bars for August 2019, 2021 and 2022, and the market’s low point over these three years. The sample of data is for condominium apartments only.
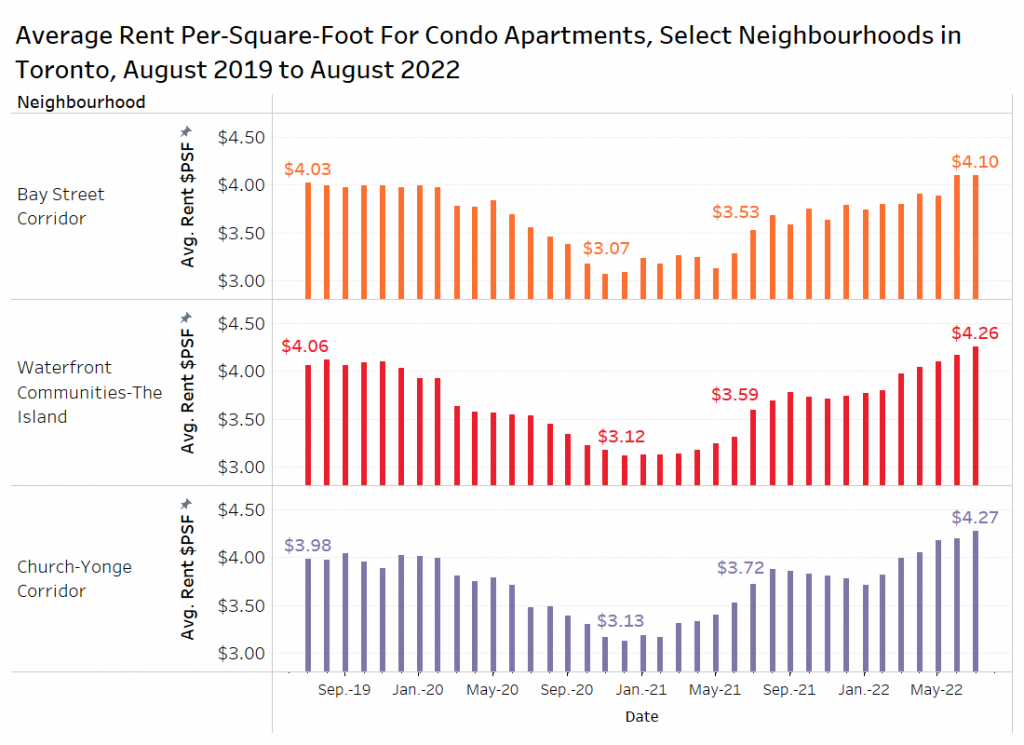
All three areas have similar rent levels, between $3.98 (Church- Yonge Corridor) and $4.06 (Waterfront Communities- the Island) in August 2019, dropping down between $3.07 (Bay Street Corridor) and $3.13 (Church- Yonge Corridor) during the pandemic-era lows of early 2021.
Over the past year, rates have moved above their pre-pandemic highs. In August this year, owners and landlords in the Bay Street Corridor were asking $4.10 per square foot. Asking rents in the Waterfront Communities-The Island have per-square-foot rents averaging $4.26, with the Church- Yonge Corridor at $4.27 per square foot.
Average Rent for Select Condo Projects
The figure below looks at the average rent in the third quarter in each of the last three years for select projects with 10 or more listings.
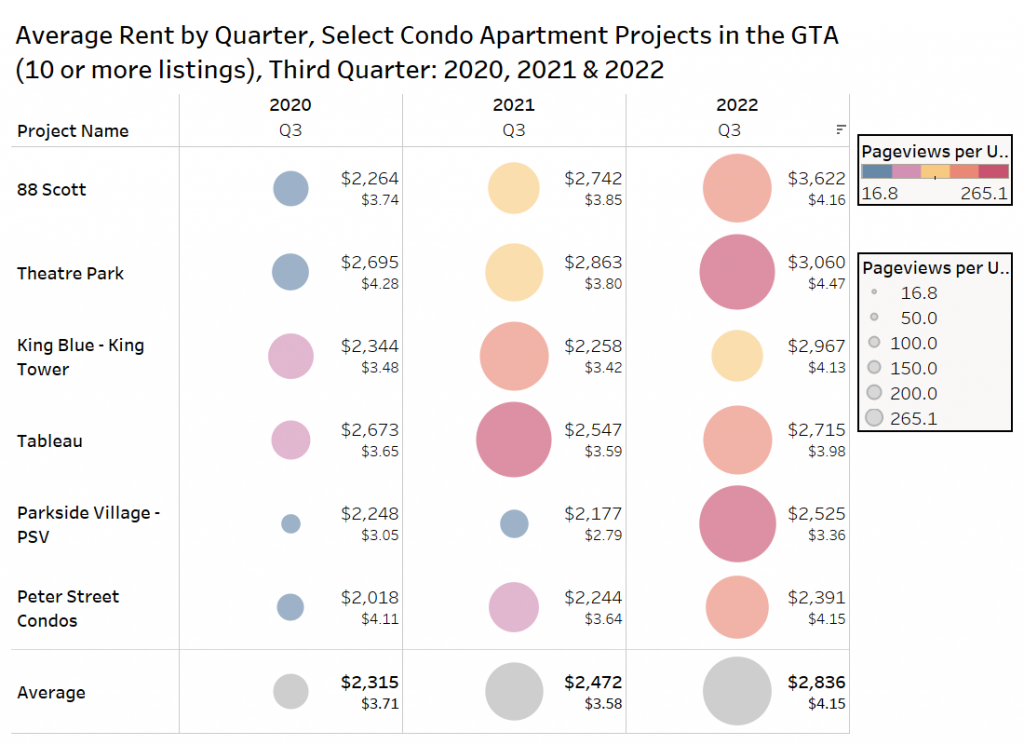
The average unit in these six projects was listed for rent at $2,315 per month or $3.71 per square foot in Q3-2020, with the average listing getting about 50 pageviews.
Fast forward to 2022, the average unit in Q3-2022 (July and August only) was offered at $2,836 per month, an increase of 22% above Q3-2020 and 15% annually. The average listing in these projects was viewed 212 times. The demand for these top condo projects is over four times greater this quarter than it was during the COVID-impacted Q3-2020, with a 22.5% increase in average rent.
Conclusion
August continued to see significant rent growth in the GTA, with average nets in many of the data categories and geographic areas passing pre-COVID-19 market highs. Overall, August saw a 2.7% increase in average rent for all property types over July. Rental rates have appreciated by 28.2% above COVID-related lows of early 2021.
The largest contributing factor in the rent inflation is the Bank of Canada’s decision to raise interest rates, which has made the carrying cost of owning more expensive and resulted in a swift decline in home sales. Demand has been pushed to rentals and with future rate hikes still on the table, the increase in tenant demand and a shortfall of rental supply will continue for the rest of this year.