
Note: Statistics and information for this article are adapted from the CMHC, Rental Market Report, 2001-2016. This information is provided for general reference and educational purposes. To access their full archive of Rental Market Reports, click here.
It’s not uncommon to hear Torontonians say that we have two seasons in the city: winter and construction. With all of this new development, why is it harder than ever to find a place to rent?
A variety of factors influence vacancy rates including population growth, government regulations, and most importantly Toronto’s housing market. Over the past decade, the housing market has been hotter than ever with housing prices increasing 33% between 2016 and 2017 alone.
To explain the variations in Toronto’s vacancy rates, we’ve compiled rental data dating back to 2000 and have broken down the major factors that influenced rates each year.
Toronto Vacancy Rates By Year
| 2017 | 2016 | 2015 | 2014 | 2013 | 2012 | 2011 | 2010 | 2009 |
| 2008 | 2007 | 2006 | 2005 | 2004 | 2003 | 2002 | 2001 | 2000 |
Toronto Rental Vacancy Rates 2018 – The Present
While rental vacancy data won’t be released for 2018 until November, here are some answers to the most pressing questions surrounding Toronto’s real estate market and its remarkably low vacancy rates.
Are we experiencing record lows in Toronto vacancy rates?
While 2017’s vacancy rate of 1% is the lowest we’ve seen since 2001, it is by no means a record low. In fact, the midst of Toronto’s condo bubble in 1986 and 1987 brought a record low residential vacancy rate of 0.1%.
What is a healthy vacancy rate?
The City of Toronto’s Affordable Housing Office considers 3% vacancy to be a healthy level for Toronto, a level that hasn’t been achieved since 2009. While what is considered to be a healthy vacancy level varies greatly by city, the fact that Toronto is now at less than half of what the city considers healthy is clear sign of an overpopulated real estate market where demand is greatly outpacing supply.
 Source: Forbes & CMHC, Rental Market Report, 2016
How does Toronto compare to other major cities?
Toronto’s 1% rental vacancy rate in 2017 especially low considering its counterparts in U.S. with Chicago at 4.6%, Los Angeles at 2.6%, and Manhattan at 2.4%. However, across Canada in Vancouver, vacancy rates are even lower in this hot housing market, dropping to a record 0.5% in 2014.
What is the impact of Ontario’s new Fair Housing Plan?
As outlined by the Ministry of Finance, the Fair Housing Plan which came into effect April 20th, 2017 is a 16 point plan aimed at stabilizing the real estate market. Notably, it expands rent control to apply to all private rental units, as opposed to just ones built after 1991, in addition to imposing a 15% tax on foreign purchases of Ontario properties. While there was reportedly a 7% drop in housing prices in May attributed to the this new bill, realtors are optimistic the market will rebound.
Toronto Rental Vacancy Rates 2017
Our Insights:
The vacancy rates in Toronto declined to 1% in 2017, down 0.3% from 2016. The CMHC attributed this decline to the “rising costs of homeownership and lack of new rental supply “. Other contributing factors include strong migrant levels and a lagging supply of rentals units.
| Toronto Rental Vacancy Rates 2017 | ||||
| Bachelor | 1-Bedroom | 2-Bedroom | 3-Bedroom+ | City average |
| 1.2% | 1.1% | 0.9% | 1% | 1% |
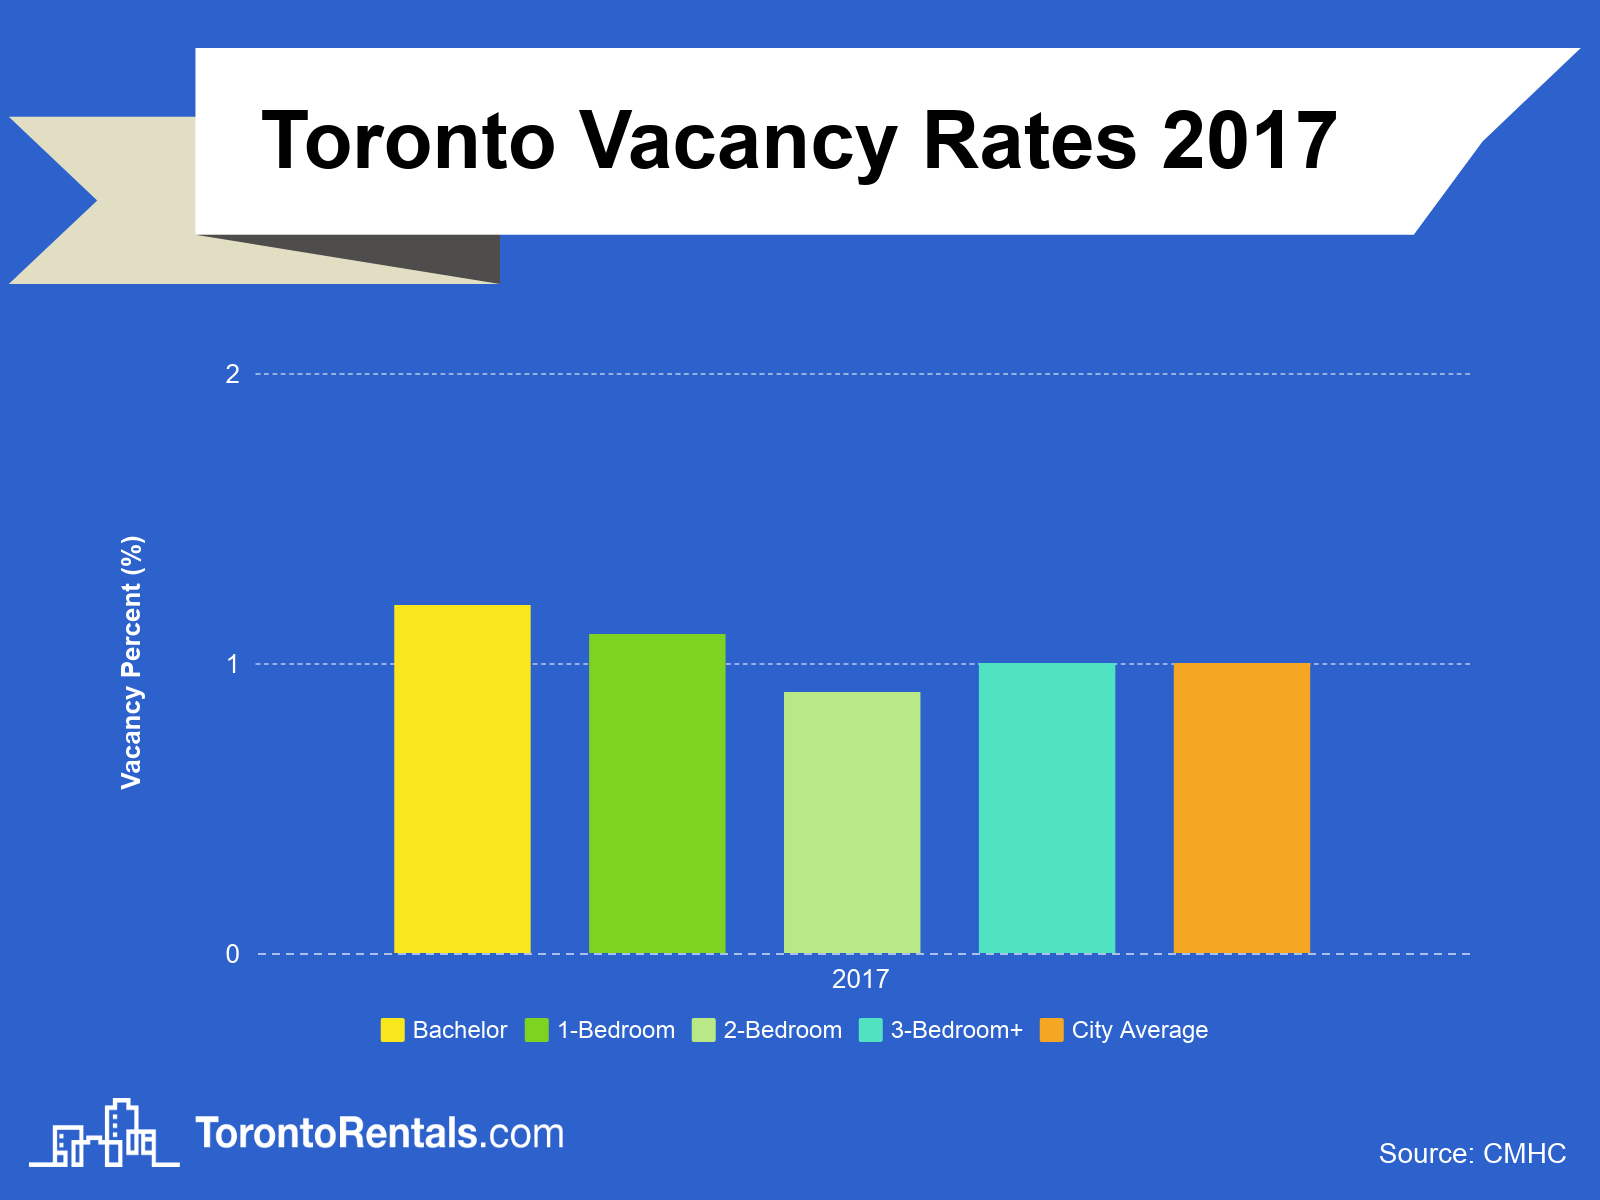
Source: CMHC, Rental Market Report, 2017
Toronto Rental Vacancy Rates 2016
Our Insights:
The vacancy rates in Toronto declined to 1.3% in 2016, down 0.3% from 2015. The CMHC attributed this decline to an increase in rental demand fueled by the rising costs of homeownership. While the cost of an average multiple-family dwelling went up by roughly 9%, average rent went up only 3.2% over the same period. Moreover, millennials and migrants continue to be the populations that drive up demand in the city.
| Toronto Rental Vacancy Rates 2016 | ||||
| Bachelor | 1-Bedroom | 2-Bedroom | 3-Bedroom+ | City average |
| 1.5% | 1.3% | 1.2% | 1.9% | 1.3% |

Source: CMHC, Rental Market Report, 2016
Toronto Rental Vacancy Rates 2015
Our Insights:
For the third year in a row, the city average for rental vacancies remained at 1.6% in 2015. The CMHC notes that rental demand was supported by higher enrollment rates at Ryerson University and the University of Toronto’s downtown campus. As well, the rental market was also bolstered by the unemployment rate declining to 7.2% in 2015, its lowest level in eight years.
| Toronto Rental Vacancy Rates 2015 | ||||
| Bachelor | 1-Bedroom | 2-Bedroom | 3-Bedroom+ | City average |
| 1.9% | 1.7% | 1.5% | 1.5% | 1.6% |

Source: CMHC, Rental Market Report, 2015
Toronto Rental Vacancy Rates 2014
Our Insights:
The city average for vacancy rates in Toronto remained the same in 2014, holding at 1.6%. However, the CMHC noted that there was variations in individual zones, with the downtown core dropping to 1.4%, down from 1.7% in 2013. Rental demand was largely driven by the millennial generation, who are now in their early 20s to mid 30s which is the largest renting demographic historically. This is in contrast to migration to Toronto being the largest support of rental demand, as it was in the early 2000s.
| Toronto Rental Vacancy Rates 2014 | ||||
| Bachelor | 1-Bedroom | 2-Bedroom | 3-Bedroom+ | City average |
| 1.5% | 1.8% | 1.4% | 1.3% | 1.6% |
 Source: CMHC, Rental Market Report, 2014
Toronto Rental Vacancy Rates 2013
Our Insights:
The rental vacancy rate remained relatively stable in 2013, dropping 0.1% to a city average of 1.6% vacancy. The CMHC attributed this stability to lower migration levels being equaled by fewer renters switching to homeownership. In addition, it was noted that rental demand was highest for less expensive units in contrast with luxury ones as budget-conscious millennials made up the largest renting demographic.
| Toronto Rental Vacancy Rates 2013 | ||||
| Bachelor | 1-Bedroom | 2-Bedroom | 3-Bedroom+ | City average |
| 1.9% | 1.7% | 1.4% | 1.7% | 1.6% |
 Source: CMHC, Rental Market Report, 2013
Toronto Rental Vacancy Rates 2012
Our Insights:
Toronto rental vacancy rates recovered slightly in 2012 to 1.7%, up from 1.4% in 2011. However, the CMHC noted that within the boundaries of the former city of Toronto, vacancy rates in fact dropped lower this year, with the downtown core sinking beneath 1%. The main factors affecting 2012’s rising and dropping vacancies rates are lower migration levels, in contrast with less demand for homeownership and strong employment levels.
| Toronto Rental Vacancy Rates 2012 | ||||
| Bachelor | 1-Bedroom | 2-Bedroom | 3-Bedroom+ | City average |
| 1.5% | 1.8% | 1.7% | 1.8% | 1.7% |
 Source: CMHC, Rental Market Report, 2012
Toronto Rental Vacancy Rates 2011
Our Insights:
Rental vacancy rates hit a 9 year low in 2011, with the city average dropping to 1.4%. Scarcer availability is attributed to a growing 25-34 population segment, Ontario’s economy fully recovering to pre-recession levels, and slowing demand for homeownership from the 25-34 population segment. As young people make up the majority of renters, population growth in this segment due to migration for jobs and immigration leads to increased demand for rental properties.
| Toronto Rental Vacancy Rates 2011 | ||||
| Bachelor | 1-Bedroom | 2-Bedroom | 3-Bedroom+ | City average |
| 1.5% | 1.5% | 1.3% | 1.7% | 1.4% |
 Source: CMHC, Rental Market Report, 2011
Toronto Rental Vacancy Rates 2010
Our Insights:
A 0.9% drop in vacancy rates was observed in 2010, bringing the city average to 2.2%. This drop was the result of slowing demand for homeownership, growing employment and immigration rates to Toronto, and a wider gap between the costs of homeownership and renting deterring potential first-time buyers. All of these causes are attributed by the CMHC to the recovering economy in 2010.
| Toronto Rental Vacancy Rates 2010 | ||||
| Bachelor | 1-Bedroom | 2-Bedroom | 3-Bedroom+ | City average |
| 2.3% | 2.4% | 2% | 1.8% | 2.2% |
 Source: CMHC, Rental Market Report, 2010
Toronto Rental Vacancy Rates 2009
Our Insights:
The vacancy rates for rental properties rose to 3.1% in 2009 as the economy continued to recover. The CMHC noted that there were lower immigration levels and that tough economic times led more youth in stay at home longer, lowering rental demand. Supply factors for vacancies also include more rental building reaching completion in 2009.
| Toronto Rental Vacancy Rates 2009 | ||||
| Bachelor | 1-Bedroom | 2-Bedroom | 3-Bedroom+ | City average |
| 5% | 3% | 2.9% | 2.8% | 3.1% |
 Source: CMHC, Rental Market Report, 2009
Toronto Rental Vacancy Rates 2008
Our Insights:
Vacancy rates experienced a large decline in Toronto to 2% in 2008, down from 3.4% in 2007. The 2008 economic recession was a huge factor in the decrease of vacancy rates across the city, as many people that would have considered purchasing their first house were deterred by the volatile job market and overall economy. As well, migration to Toronto from other parts of Canada and abroad continues to contribute to low vacancy rates as Toronto’s population increases.
| Toronto Rental Vacancy Rates 2008 | ||||
| Bachelor | 1-Bedroom | 2-Bedroom | 3-Bedroom+ | City average |
| 2.1% | 2% | 1.9% | 2.2% | 2% |
 Source: CMHC, Rental Market Report, 2008
Toronto Rental Vacancy Rates 2007
Our Insights:
The city average of vacancy rates remained relatively stable in 2007, climbing 0.1% to be 3.4%. While 3-bedroom+ units saw a huge vacancy jump to 4.6%, this growth is led by the outskirts of Toronto with zone 17 (Northwest North York) having a rate of 10.8% and zone 7 (North Etobicoke) have a rate of 14.6%. The CMHC attributed the overall stability of vacancy rates in Toronto to an equal amount of renters transitioning to homeownership as there was new immigrants and young people beginning to rent.
Additionally, the Residential Tenancies Act (RTA) came into effect on January 31, 2007. Replacing the former Tenant Protection Act, the RTA introduced rent control only to units built or occupied before November 1991. For these units, landlords may not increases rent prices each year beyond Ontario’s CPI increase (amended to a maximum of a 2.5% increase each year in 2012).
| Toronto Rental Vacancy Rates 2007 | ||||
| Bachelor | 1-Bedroom | 2-Bedroom | 3-Bedroom+ | City average |
| 2.8% | 3.2% | 3.4% | 4.6% | 3.4% |
 Source: CMHC, Rental Market Report, 2007
Toronto Rental Vacancy Rates 2006
Our Insights:
Rental vacancy rates declined to 3.2% in 2006 on average in Toronto. The causes of this downward trend are higher mortgage rates and increased immigration, which increase ddemand for rental units. The CMHC particularly noted there was a widening gap between average rent costs and the average owner’s principal and interest payment, making homeownership less attractive in comparison to rentals.
| Toronto Rental Vacancy Rates 2006 | ||||
| Bachelor | 1-Bedroom | 2-Bedroom | 3-Bedroom+ | City average |
| 3.5% | 3.6% | 3.1% | 3.2% | 3.3% |
 Source: CMHC, Rental Market Report, 2006
Toronto Rental Vacancy Rates 2005
Our Insights:
For the first time in 4 years, vacancy rates decreased in 2005 to 3.7%. The CMHC attributed this decrease to strong immigration levels, lower rent prices, and a lower amount of rental unit completions. Within Toronto, the largest vacancy decrease was seen in Etobicoke, where vacancy rates dropped to 4.3%, down from 5.2% in 2004.
| Toronto Rental Vacancy Rates 2005 | ||||
| Bachelor | 1-Bedroom | 2-Bedroom | 3-Bedroom+ | City average |
| 4.3% | 3.8% | 3.6% | 4.1% | 3.8% |
 Source: CMHC, Rental Market Report, 2005
Toronto Rental Vacancy Rates 2004
Our Insights:
The year 2004 marked the peak of Toronto’s vacancy rates in the last century, with the city average hitting 4.4%. However, this 0.6% increase from 2003 showed a slowing vacancy increase and turning point in the market. While many units continued to remain vacant due to low mortgage rates attracting homeownership and due to competition from condominiums, overall condominium completion rates began to slow this year. The CMHC also noted that vacancy rates rose in 21 of Canada’s 28 major urban centres.
| Toronto Rental Vacancy Rates 2004 | ||||
| Bachelor | 1-Bedroom | 2-Bedroom | 3-Bedroom+ | City average |
| 4.1% | 4.3% | 4.4% | 4.5% | 4.4% |
 Source: CMHC, Rental Market Report, 2004
Toronto Rental Vacancy Rates 2003
Our Insights:
Vacancy rates in Toronto increased by 1.4% to equal 3.8% in 2003. The rental market continued to ease due to the completion of a variety of condominiums and the continuation of low mortgage rates. The CMHC declared vacancy rates to be at their highest since the inception of their annual Rental Market Survey after World War II.
| Toronto Rental Vacancy Rates 2003 | ||||
| Bachelor | 1-Bedroom | 2-Bedroom | 3-Bedroom+ | City average |
| 3.9% | 4.2% | 4% | 3.7% | 3.7% |
 Source: CMHC, Rental Market Report, 2003
Toronto Rental Vacancy Rates 2002
Our Insights:
Vacancy rates jumped to 2.4% across Toronto in 2002, the highest level since 1972. The CMHC attributed this jump to rent increases, weaker rental demand, and heightened competition from condominiums as mortgage rates continued to decline. Moreover, economic recovery in addition to low mortgage rates allowed many renters to transition to homeownership.
| Toronto Rental Vacancy Rates 2002 | ||||
| Bachelor | 1-Bedroom | 2-Bedroom | 3-Bedroom+ | City average |
| 2.8% | 2.6% | 2.2% | 2.3% | 2.4% |
 Source: CMHC, Rental Market Report, 2002
Toronto Rental Vacancy Rates 2001
Our Insights:
The year 2001 began an upturn in vacancy rates in Toronto, with the city average increasing 0.3% to be 0.9%. This was due to low homeownership costs, economic recovery, and the effects of the Tenant Protection Act (TPA). The TPA was passed by the Harris government in 1998 and it championed relaxed rent control. In response, landlords began raising rent prices in a way that outpaced rental demand, which resulted in more people choosing to buy houses, and overall higher rental vacancy rates.
| Toronto Rental Vacancy Rates 2001 | ||||
| Bachelor | 1-Bedroom | 2-Bedroom | 3-Bedroom+ | City average |
| 1.2% | 0.9% | 0.7% | 0.8% | 0.9% |
 Source: CMHC, Rental Market Report, 2001
Toronto Rental Vacancy Rates 2000
Our Insights:
Surprisingly, the year 2000 had a city average of 0.6% for vacancy, even lower than what Toronto is experiencing today. According to the CMHC, strong immigration levels and economic recovery were the main factors for the heightened demand in rentals. They also noted that vacancy rates were lower in 17 of Canada’s 26 major centres compared to the previous year.
| Toronto Rental Vacancy Rates 2000 | ||||
| Bachelor | 1-Bedroom | 2-Bedroom | 3-Bedroom+ | City average |
| 1.2% | 0.9% | 0.7% | 0.8% | 0.9% |
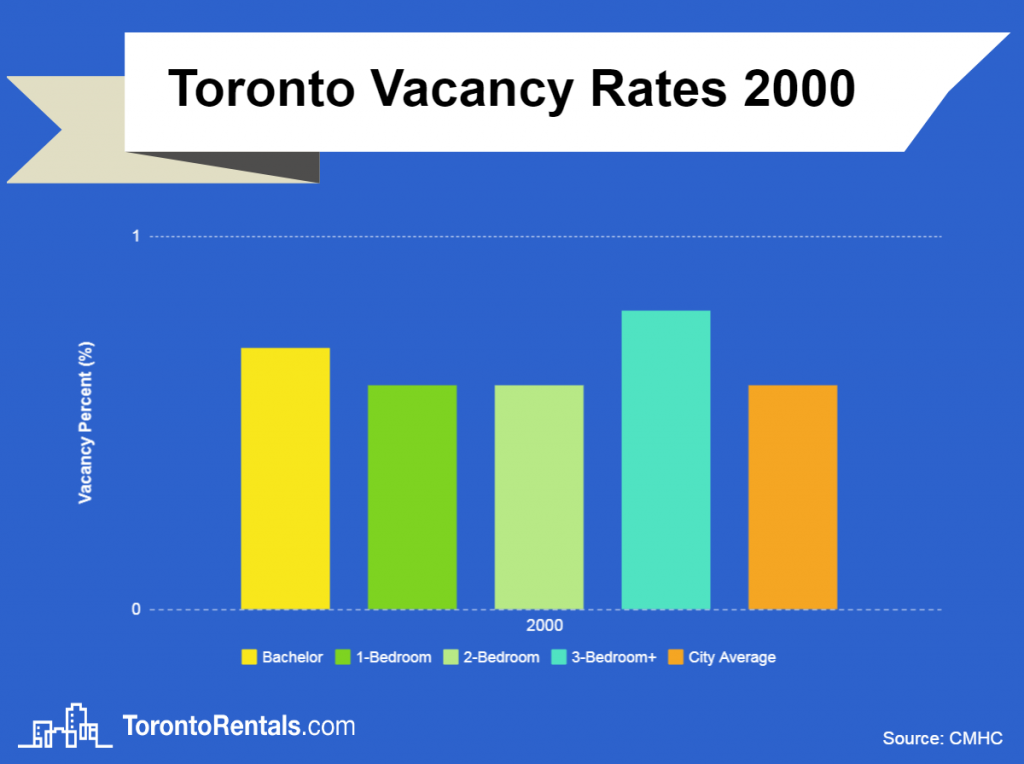
Source: CMHC, Rental Market Report, 2000
Additional Info
- CMHC Rental Market Report Archive
- Ontario’s Complete Fair Housing Plan
- Toronto Real Estate Board Website