Average Rent and Monthly Change in Average Rent in the GTA
The average asking rental rates continue to rise in the GTA with the last three months seeing increases of 5.7%, 3.1% and 3.3% respectively. The data shown in the chart below is based on aggregated TorontoRentals.com listings for all residential property types (single-family homes, townhouses, condominium apartments, rental apartments and basement apartments).
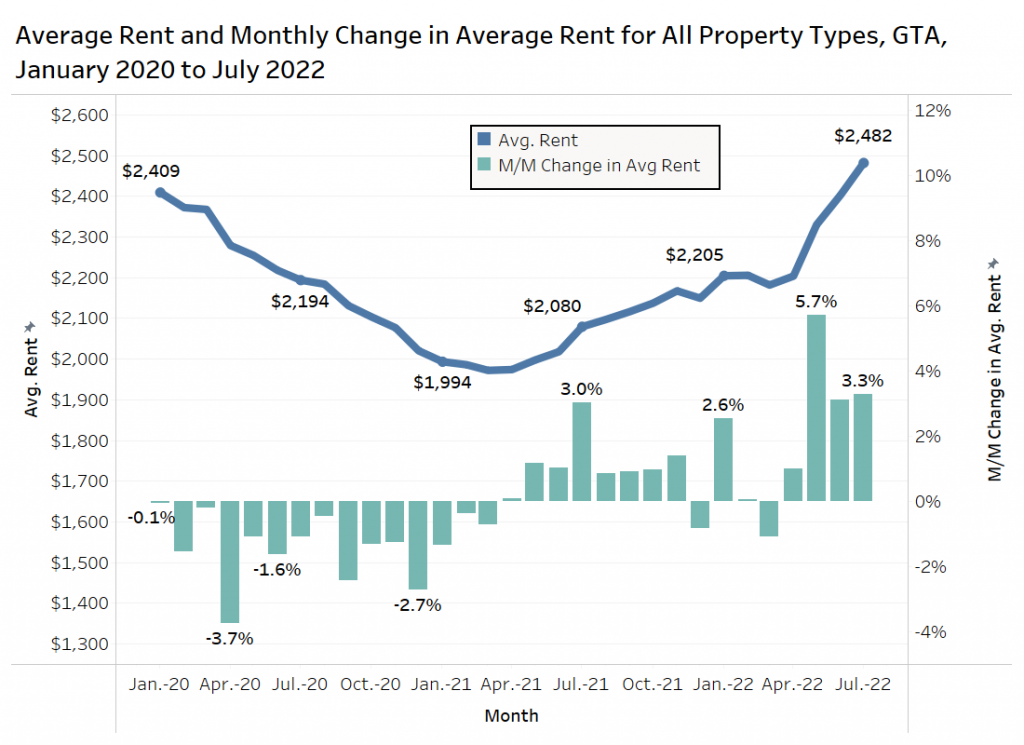
The average rent of $2,482 per month is up by more than $400 from July of 2021, an annual increase of 19.3%. The average rent topped the market high of $2,460 per month in November 2019.
Average Rent by Property Type in the GTA
The chart below presents data on the average rent by property type in the GTA in June and July in each of the last four years based on TorontoRentals.com listings data.
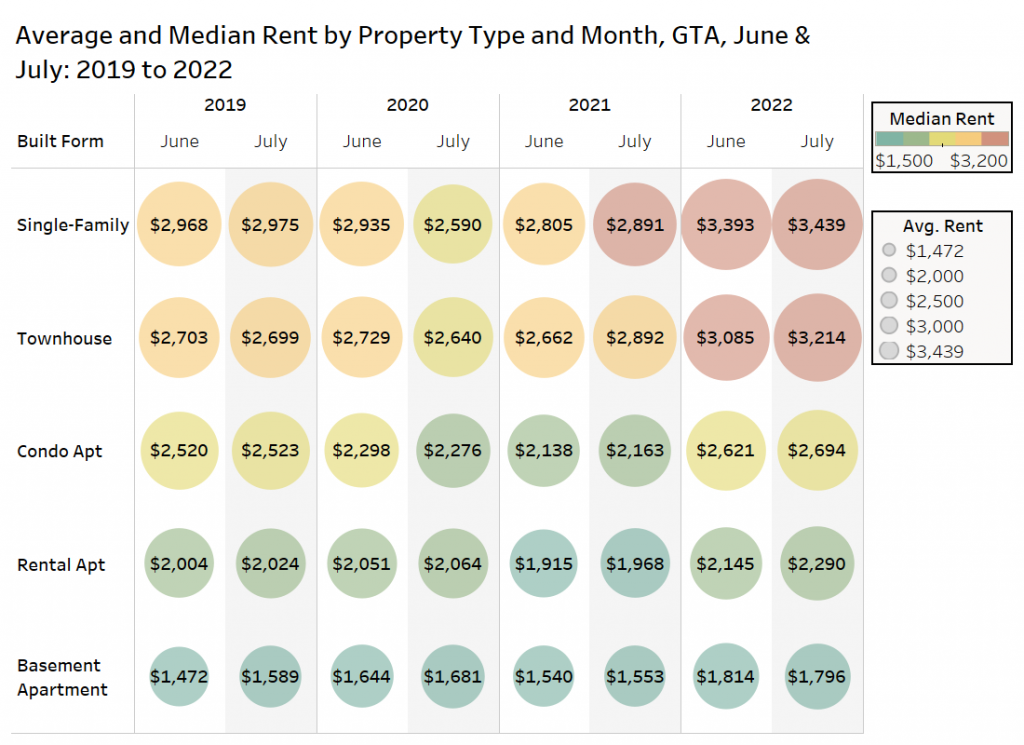
Single-family rents increased month over month in the GTA (single-detached and semi-detached properties), rising 1.3% ($46) from $3,393 in June to $3,439 in July. On an annual basis, average rents increased by 19%. Average monthly rents in July 2022 were up by $464 per month over July 2019.
Condominium apartment rents increased by 2.8% ($73) monthly and by 25% annually to $2,694. In July of 2019, prior to the pandemic, the average monthly rent was $2,523.
Rental apartments saw growth of 6.7% ($134) month-over-month, and 13% year over year, with an average monthly rent of $2,290 in July 2022 — this rate is boosted by a number of new Toronto-area rental apartments starting leasing programs. Looking back to July in 2019 and 2020, landlords were asking $2,024 per month and $2,064 per month, respectively in those periods.
Average Rent by Bedroom Type in the GTA
All suite types in the GTA have experienced substantial annual rent growth from July 2021 to July 2022, with four out of the five bedroom types experiencing double-digit percentage increases in terms of average asking rent.
Studio monthly rents rose by 14% annually, one-bedrooms by over 15%, two-bedrooms by 19%, three-bedrooms by 14%. Four-bedroom units rose by a modest 3%. Given the wide range of four-bedroom properties from older apartments to large single-detached homes on large lots, there is volatility in the monthly data.
Excluding the four-bedroom units, month-over-month average rents from June 2022 to Juy 2022 ranged from 2.2% to 2.9%.
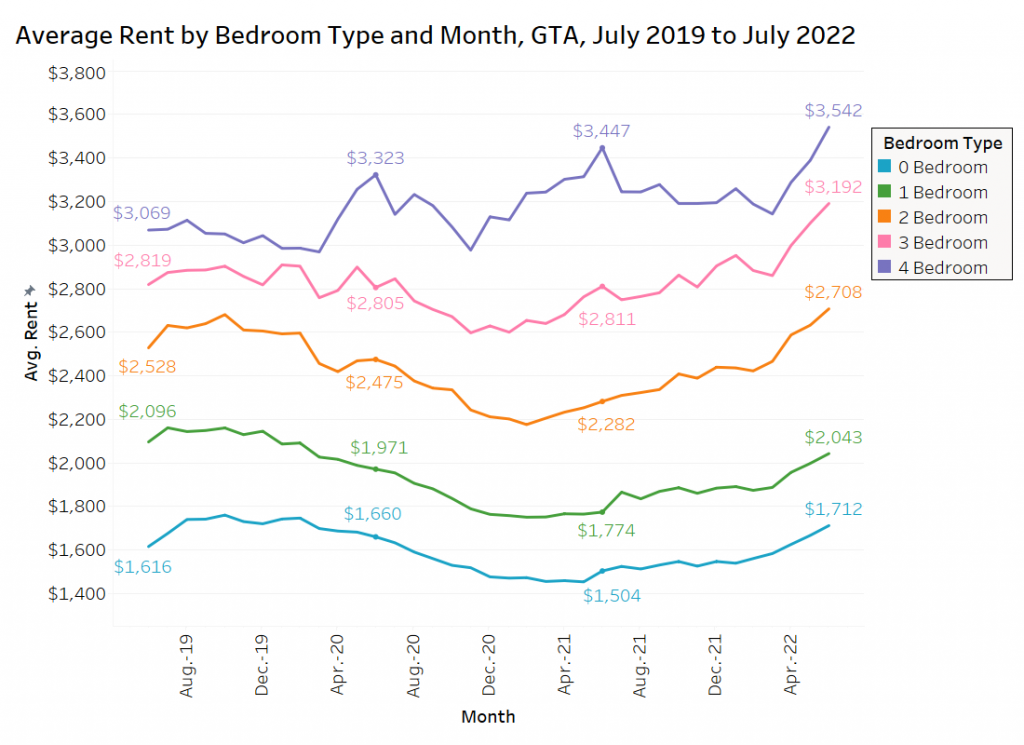
One-bedroom units are the only suite type where average rents in July 2022 are not higher than July of 2019, which is likely due to the lingering impacts of working from home, and the desire for more space.
Average Rent and Annual Change in Average Rent by Area
The table below looks at the average rent for condominium apartments and rental apartments in select municipalities in the GTA for June and July over the past three years, with the average annual change also marked.
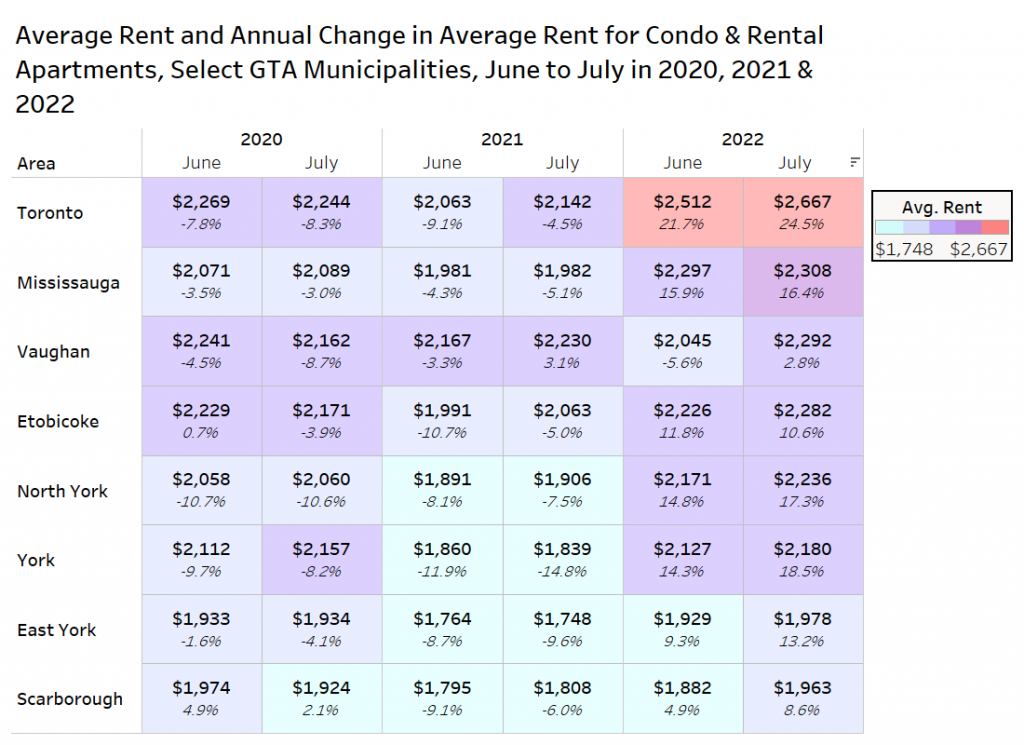
Toronto has the highest average rents at $2,667 per month in July 2022, up by nearly 25% annually. Last July, average rents had declined by about 5% annually in Old Toronto, following an 8% annual decline in July 2020. In Toronto, rents grew by a whopping 6.2% month over month.
Mississauga has the second most expensive rents among the municipalities featured above, the $2,308 average rent for condo and rental apartments is up 16.4% over July 2021.
Among the municipalities and former municipalities above, Vaughan had the lowest annual growth at a more modest 2.8%, but Vaughan was the only municipality that experienced annual rent growth in July 2021. Given the lack of rental apartments in Vaughan, and a high number of condominium completions in Vaughan contributed to the rent growth last year.
Average Rent Per-Square-Foot by Area
The chart below shows the average rent per-square-foot for condo and rental apartments by month in old Toronto, Mississauga and the former cities of Etobicoke and North York.
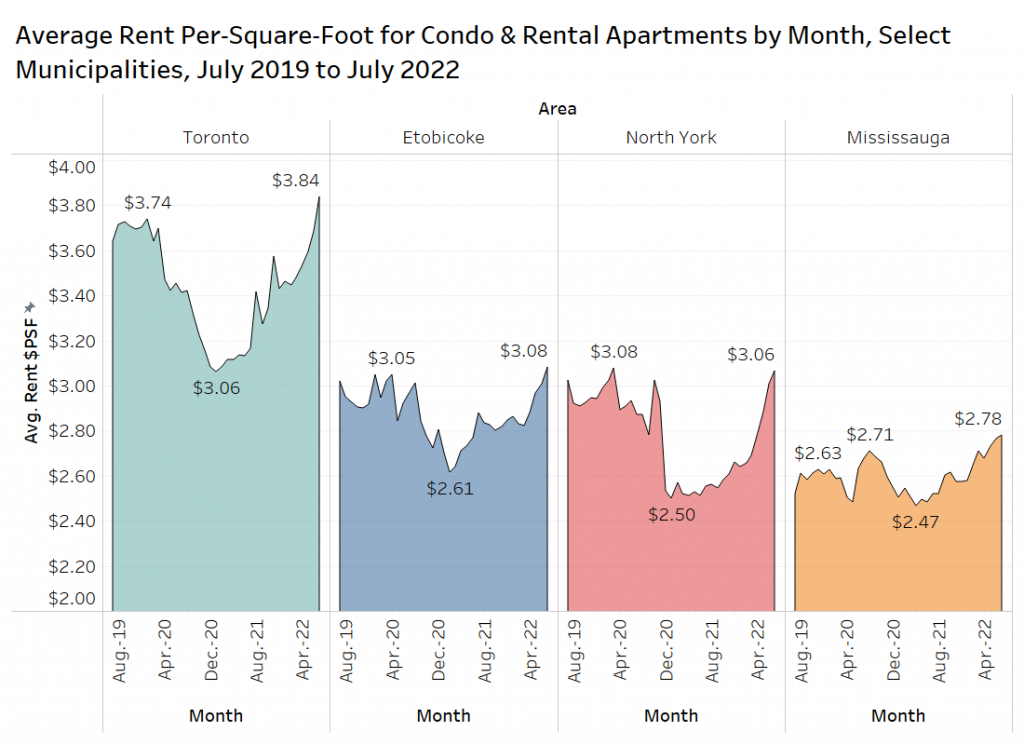
The data marked in the graph are the July 2022 rents per-square-foot (psf), as well as the minimum and maximum rent level over the past three years. Toronto rents hit a low of $3.06 psf in January 2021, rising by 25% since that point to $3.84 psf.
In Etobicoke, average rent per-square-foot was $3.08 in July 2022, very similar to the North York rate of $3.06. Etobicoke reached a high of $3.05 in April 2020, right before the pandemic really pushed down rents, while North York hit $3.08 in March of 2020.
Mississauga’s monthly per-square foot rent was $2.78 in July 2022, up $0.31 psf (12.6%) from $2.47 per month in April 2021, and surpassing the previous market peak of $2.71 psf in August 2020.
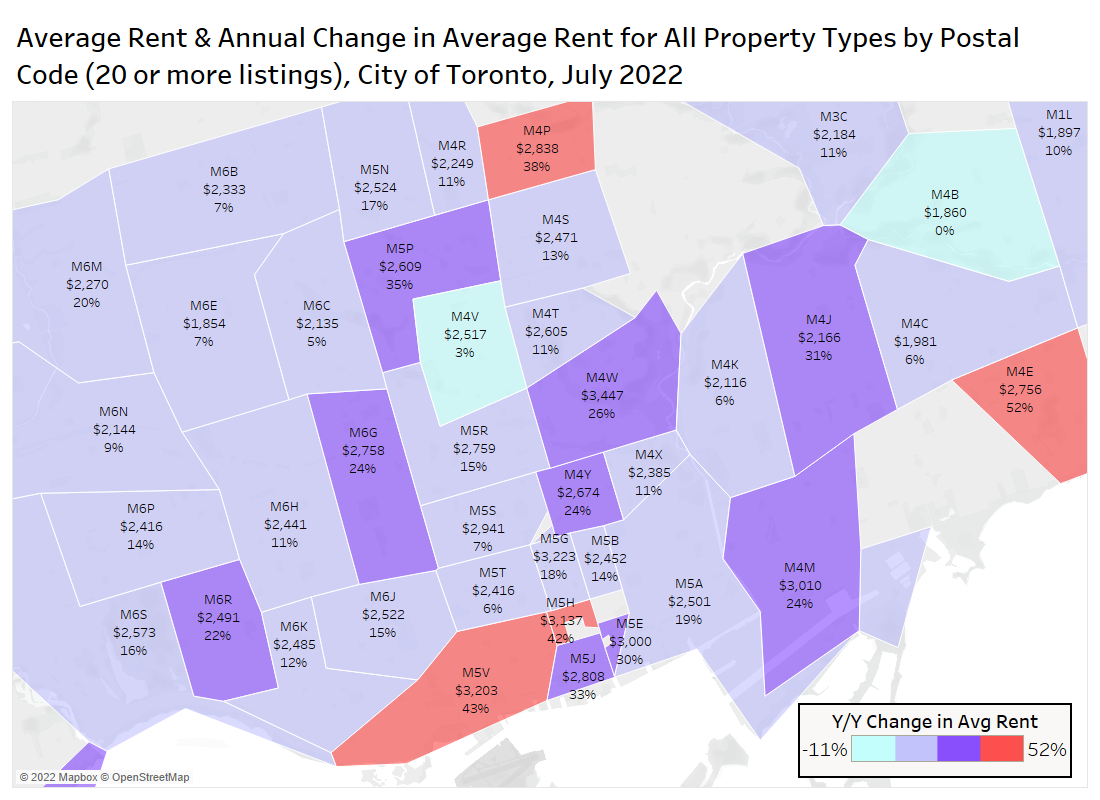
Annual Rent Growth in Toronto by Postal Code
The map below shows the average rent and annual change in average rent for all property types by postal code in the amalgamated City of Toronto in July 2022. The colours of the postal codes correspond to the annual change in average rent.

Postal code M4E, which includes The Beach and the Upper Beaches with a relatively small sample size area, has seen rents increase by 52% annually to $2,756 per month. However, it is likely that the composition of units played a factor in the outsized growth.
Postal code M5V is one of the most active areas of the city, which includes the Entertainment District, King West and Cityplace. The average rent increased by 43% annually to $3,203 per month.
Just to the east of M5V is a smaller postal code M5H, where average rent for all property types is up 42% year-over-year to $3,137 per month. However, the sample size of listings is small in this area.
Postal code M4P, which is the Yonge and Eglinton area (northeast quadrant), has seen rents increase by 38% annually to $2,838 per month. However, this area also has a composition issue, as rents are boosted by listings at two new purpose-built rental apartments, The Whitney at Redpath and The Parker.
In postal code M4Y, which includes The Village and part of the Downtown Yonge area, is an active postal code in terms of rental activity where rents grew by 24% annually to $2,674 per month.
Average Rent by Neighbourhood
The next chart looks at the average rent per-square-foot by neighbourhood for condo and rental apartments in the city of Toronto.
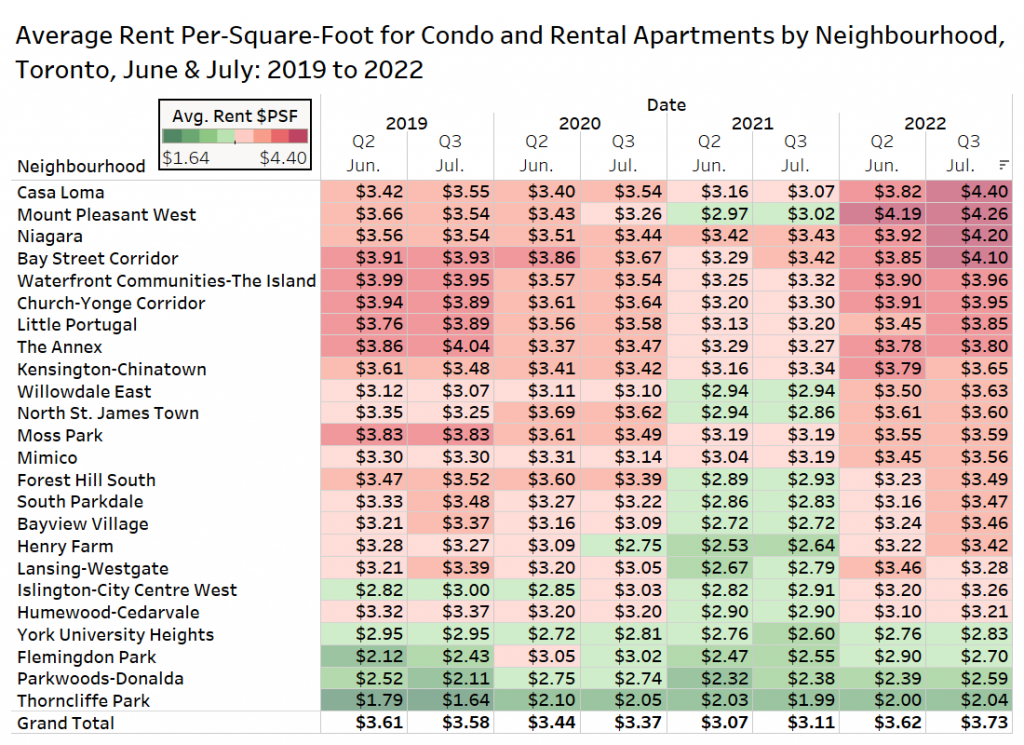
The average monthly rent per-square-foot in July for these top neighbourhoods is $3.73, an increase of 3% monthly ($0.11) and 20% annually.
The most expensive market is the Casa Loma neighbourhood, where monthly growth is 15.2% ($0.58 psf), and annual growth is up $1.33 psf, a 43% increase. The rise is attributed to the completion of a luxury rental development called 2Fifteen, and the inclusion of the newly renovated, high-end rental Two Clarendon.
The most active neighbourhood in terms of listings activity is the Waterfront Communities-The Island, where monthly rent increased from $3.32 psf in July 2021 to $3.96 psf in July 2022, this represents annual growth of over 19%. Before the pandemic in the summer of 2019, rents reached a nearly identical $3.95 psf.
Average Rent at Select New Condo Projects
The chart below looks at the average rent at the most active condominium apartment projects in Toronto during the four-month stretch of April to July over the past four years. The projects include at least 10 listings in each of the four periods, with the size of the markers reflective of the median rent, while the colour and the text represent the average rent.
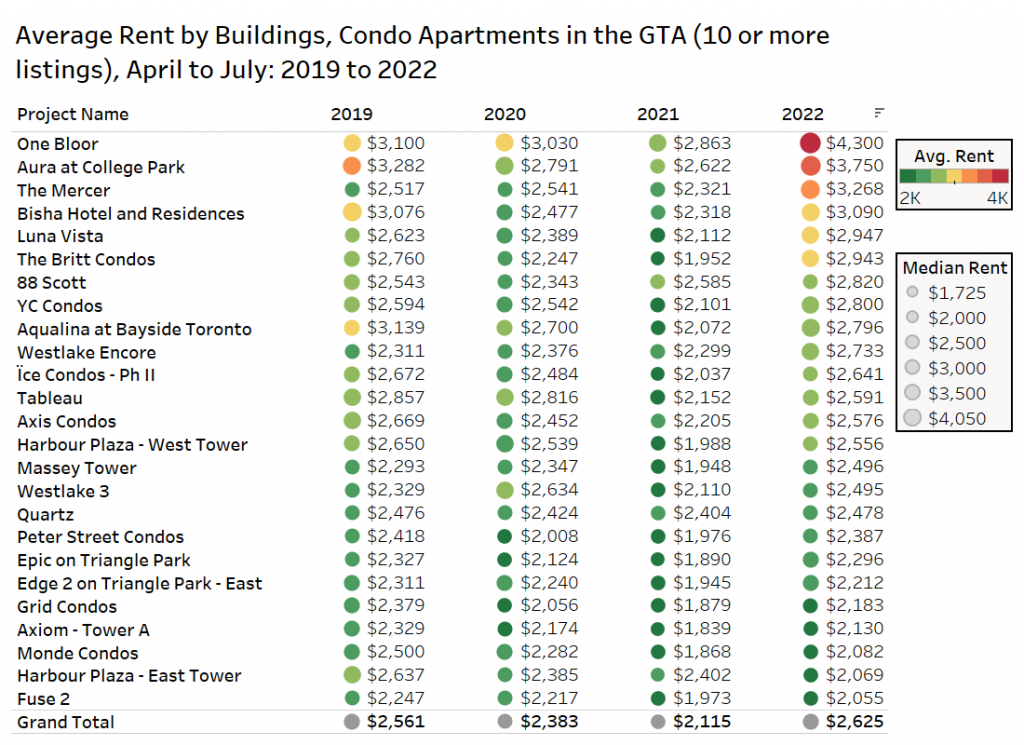
Overall, rents at these 25 projects averaged $2,625 per month during the April 2022 to July 2022 time period, increasing by 24% over this same four-month stretch in 2021. This rent level is 2.5% higher than the rate achieved in this four-month period in 2019 at these same projects.
Several of these condos have experienced staggering increases, both in terms of year-over-year percentage increase and monthly rental amount. One Bloor average rents are $4,300, a substantial increase of 50% (boosted by a couple of large suites for lease this year), and Aura at College Park is up to $3,750, a 43% increase.
At the other end of the spectrum, Fuse 2 posted average rent of $2,055 during the period, a moderate increase of 4.2%.
The Most Popular New Rental Apartments by Pageviews
There has been a resurgence in the construction of new purpose-built rental apartments in Toronto over the past five years. Users of TorontoRentals.com have clicked on these developments thousands of times over the past four months, here are the most popular 20 buildings (includes only apartments that have been occupied/starting leasing since 2019).
The size and colour of the markers reflects the average rent.
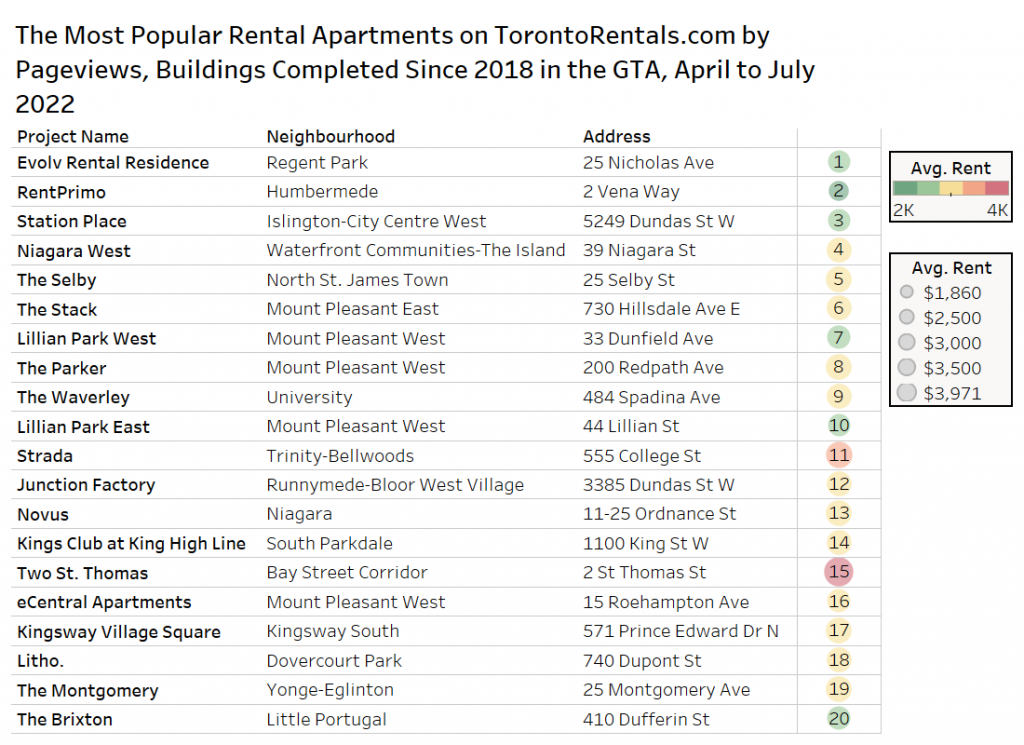
The most popular building is Evolve Rental Residence, which is part of the revitalization and redevelopment of Regent Park, having an average asking rent of $2,330 per month over this four-month period this year. The second most popular building, RentPrimo, is also the least expensive on the market, with an average rent of $1,860 per month.
The most expensive project is Two St. Thomas, this luxury building near Bay and Bloor is the 15th most popular, and listings from April to July 2022 have been offered at $3,971 per month on average.
Conclusion
The Toronto rental market is on fire. Across every metric examined in this report, massive increases are taking place. There are many major cities where average rent has not increased by 3% in a year, but the GTA has experienced 3% or greater rent growth in May, June and July of this year.
It is an unprecedented time in our economy, where unemployment figures remain solid, immigration is high, but so is inflation, and interest rates are expected to be hiked again this year. The rise in monthly carrying costs of ownership housing, coupled with the rapidly declining resale house prices have pushed demand into the rental market, And, some would-be sellers have decided to lease their homes instead of sell them. This increased supply has not offset the high demand, and much of this supply is relatively expensive, which is likely pushing the average rent up.
It should be noted again that this data is based on asking rents, and when a new purpose-built rental apartment starts leasing, the owner might list all of these units on the market, many of the luxury variety, which has contributed to the higher rents over the last three months.
Despite affordability concerns, there still appears to be strong demand for larger rental offerings, with two-bedroom units up 19% annually. However, the rent growth in the GTA is clearly being driven by the properties in Old Toronto (pre-amalgamation boundaries), with rents rising by about nearly 25%. Within Toronto, the M5V postal code has experienced annual rent growth of 43%.
In the short term, TorontoRentals.com and Bullpen Consulting expect rents to continue to accelerate, as the fall market is the strongest for demand during a typical year.