Average Rent in the GTA
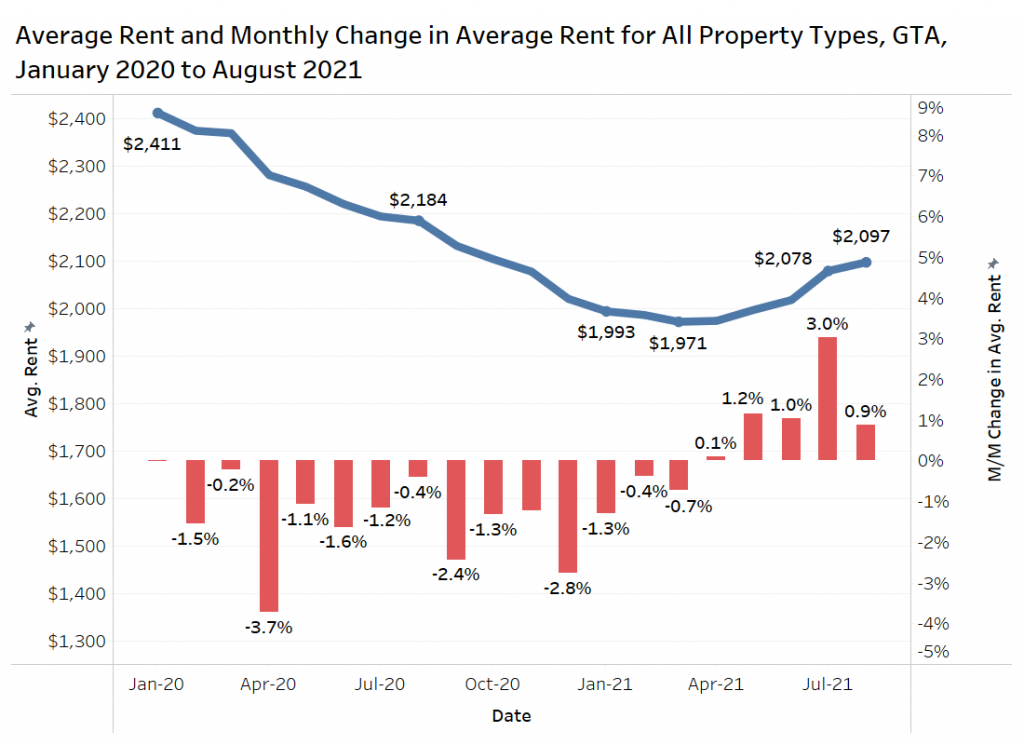
The average rent for all property types in the Greater Toronto Area (GTA) trended downward throughout 2020, with monthly declines as large as 3.7% — this data includes single-family homes, townhouses, condominium apartments, rental apartments, and basement apartments.
In April 2021, the trend reversed, as the monthly rental rates began increasing. In August 2021, the average rental rate in the GTA increased 0.9% month over month to $2,097 per month (refer to the chart below which shows the average rent in blue, and the monthly changes via the red bars).
Despite the recent uptrend, the average rent is down 4% annually from $2,184 per month in August 2020, and 14% from August 2019’s average rent of $2,450 per month.
Average Rent by Number of Bedrooms
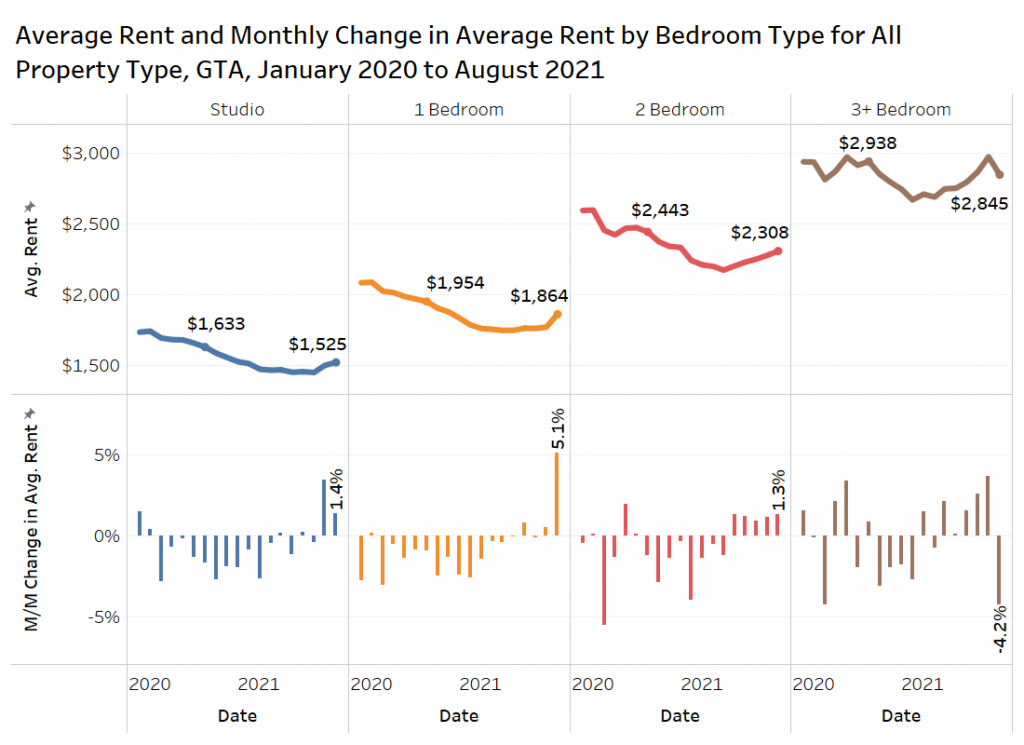
The average rent for studio, one-bedroom, and two-bedroom units all experienced month-over-month increases in average rent in August 2021 (including all property types in the GTA). Studio units increased 1.4% monthly to $1,525 per month on average. One-bedroom units increased by a whopping 5.1% monthly to $1,864 per month. Two-bedroom units increased 1.3% monthly to $2,308 per month.
After several months of positive month-over-month changes in units with three or more bedrooms, August 2021 saw the average rent for this market segment decline by 4.2% monthly to $2,845 per month. There is a smaller sample size of three-bedroom and larger units, and a wide range for products from a 800-square-foot, three-bedroom basement apartment in the suburbs, to a 4,500-square-foot, six-bedroom, single-detached house in downtown Toronto. This wide range of products contributes to the monthly volatility in the average rent for these larger properties.
In comparison to last August, the average rent is still lower for all bedroom types.
Average Rent Per Square Foot by Property Type and Bedroom Type
The following chart looks at the average rent per square foot by property type and bedroom type in the GTA, with the monthly change in that rent level also shown.
Condo apartments had the highest average rent per square foot across all bedroom types, averaging a high of $3.99 per square foot for studio units to $2.94 per square foot in three-bedroom or larger units.
Basement apartments had the lowest average rent per square foot for studio and one-bedroom units, while single-family homes had the lowest average rent per square foot for two-bedroom and three-plus-bedroom units. Please note that a one-bedroom townhouse is likely a stacked townhouse.
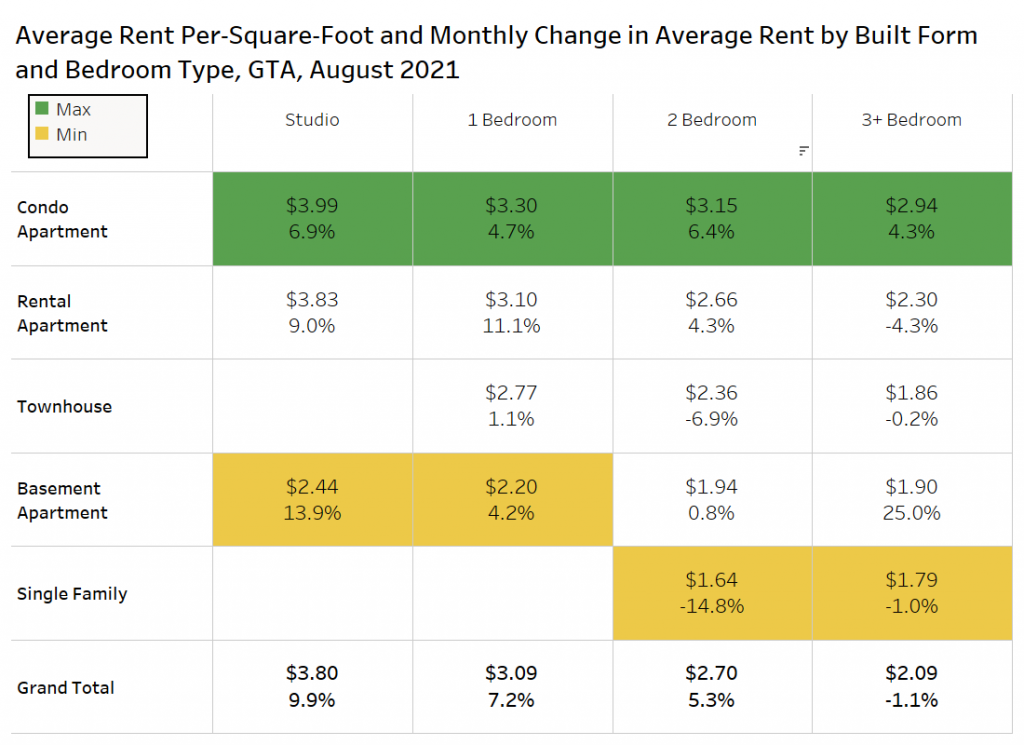
When considering all property types in August, there was strong monthly growth in studio units, experiencing an overall average increase of 9.9% monthly, with larger units (three-bedroom-plus) seeing an overall decline of 1.1% monthly.
There was huge growth in the rents for studio and one-bedroom rental apartments at 9% and 11%, bolstered by a couple of new apartment completions adding higher-priced supply to the market.
Average Rent by Area in the GTA
The map below shows the change in average rent month over month in August for a select number of GTA municipalities, as well as the former municipalities in the city of Toronto.
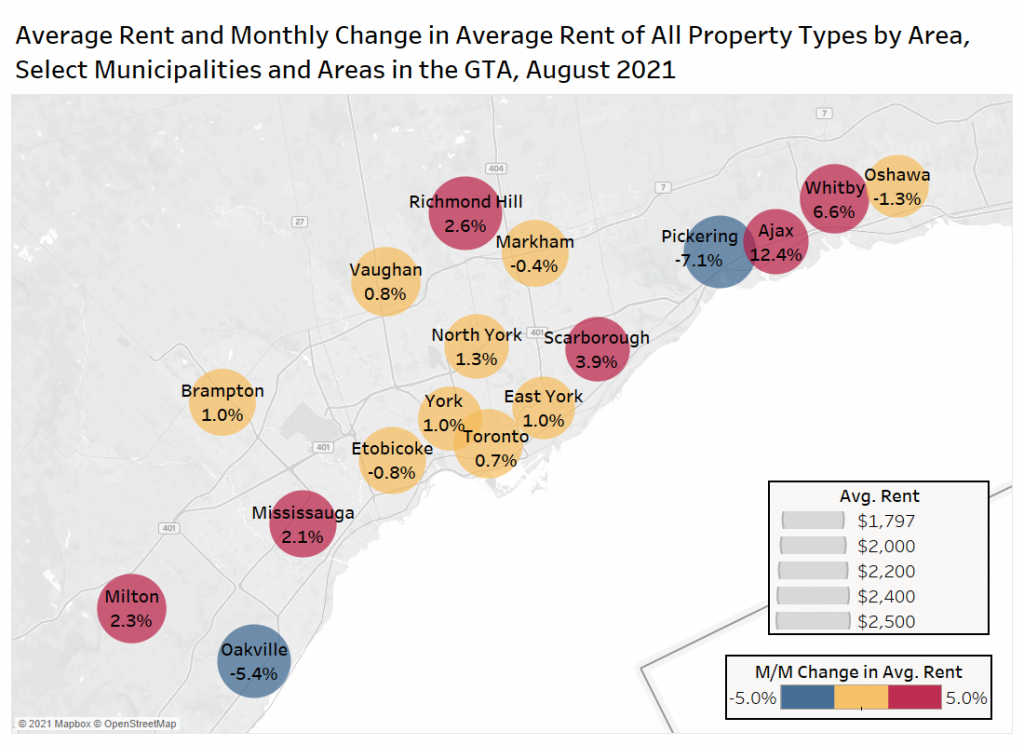
The majority of the areas in the GTA experienced monthly increases in average rent. Several of the smaller cities experienced outsized gains or declines, which is more likely a factor of a changing sample of listings.
The major areas of focus should be the pre-amalgamation areas within Toronto and Mississauga. The average rent declined slightly in Etobicoke by 0.8%, but rose 0.7% to 1.3% in Toronto, York, East York and North York. The bigger gains were experienced in Mississauga at 2.1% monthly growth, topped by Scarborough at 3.9%.
Average Rent in the GTA by Area and Property Type
The chart below shows the average rent for single-family homes, condominium apartments, and rental apartments for select municipalities and former municipalities in the GTA.
The average rent for single-family homes in the GTA has increased throughout 2021 in most of the most active markets on TorontoRentals.com. The August 2021 average rental rates in York and Mississauga in particular, have surpassed the levels seen at the peak of the rental market in late 2019. Toronto, Etobicoke, North York, and Scarborough on the other hand, have seen their average rental rates return to similar levels experienced at the start of 2020, prior to the pandemic.
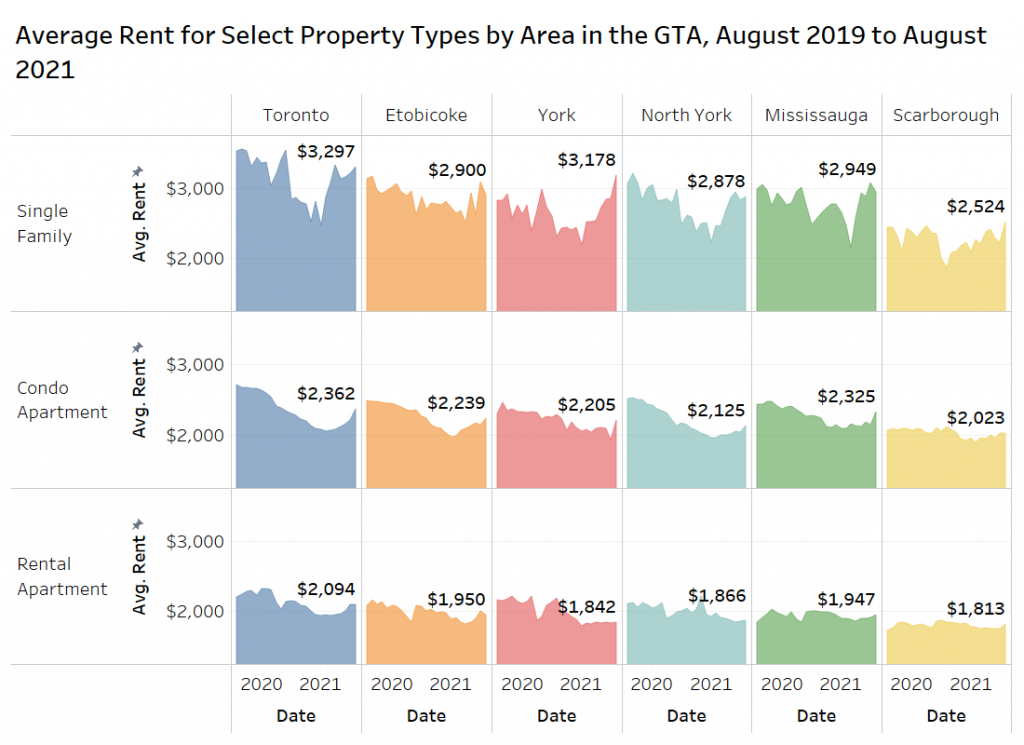
The average rents for condo apartments, after steadily declining throughout 2020, have not risen as quickly as those of single-family homes. Toronto, Etobicoke, North York, and Mississauga are trending upward the fastest in August, while York and Scarborough are flat.
The average rent for purpose-built rental apartments, after declining for most of 2020, have also shown increases throughout 2021. In particular, the average rents in Toronto and Etobicoke are trending upward heading into August 2021, while average rents in York, North York, Mississauga, and Scarborough remain relatively stable. The average rent in the former city of Toronto was $2,094 per month in August, up 8% from the March 2021 low of $1,938 per month.
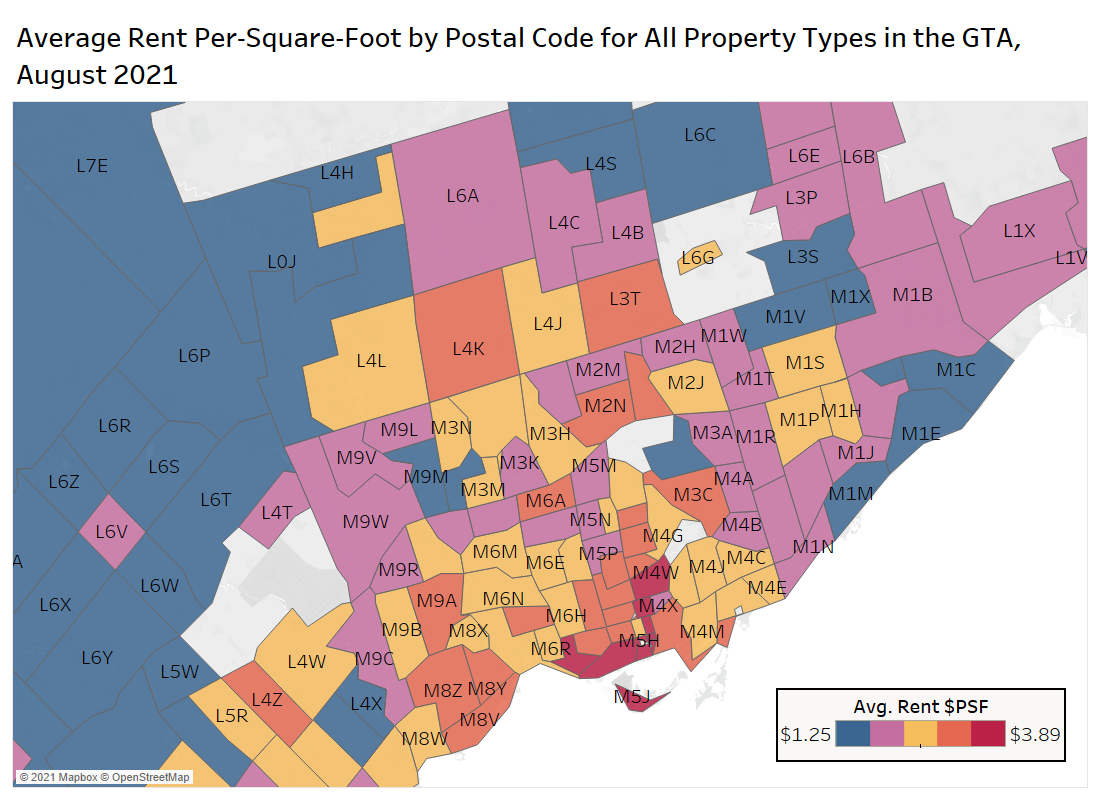
Postal Codes
The postal codes with a high average rent per square foot are clustered in the downtown Toronto area, with the downtown west higher priced than the downtown east.

In south Etobicoke, rents per square foot are also high, driven by the waterfront condos in the Humber Bay Shores area (postal code M8V).
Average Rent by Neighbourhood and Bedroom Type
The chart below shows the average rent by bedroom type for all property types for select neighbourhoods in the GTA.
The area with the highest rents is University in Toronto at $2,459 per month, and the area with the highest two-bedroom rents is Bay Street Corridor at $2,922 per month.
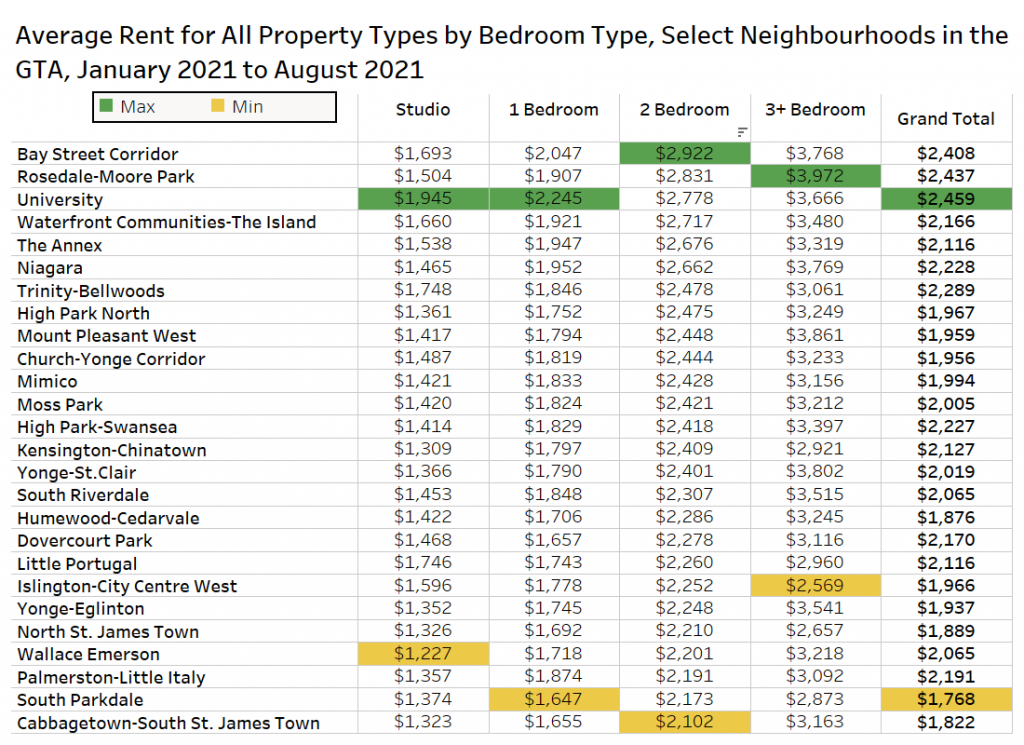
It is approximately 27% cheaper to live in South Parkdale on average compared to Rosedale-Moore Park.
Average Rent by Neighbourhood – Condo & Rental Apartments
The chart below shows the average rent for five of the most active Toronto neighbourhoods over the past year, showing the average monthly rent (top), and average rent per square foot (bottom). The data is for condominium apartments and rental apartments only. The size of the markers reflects the average pageviews per unit on TorontoRentals.com. The lines are much thicker in recent months as the rental market has rebounded, and received significant interest online.
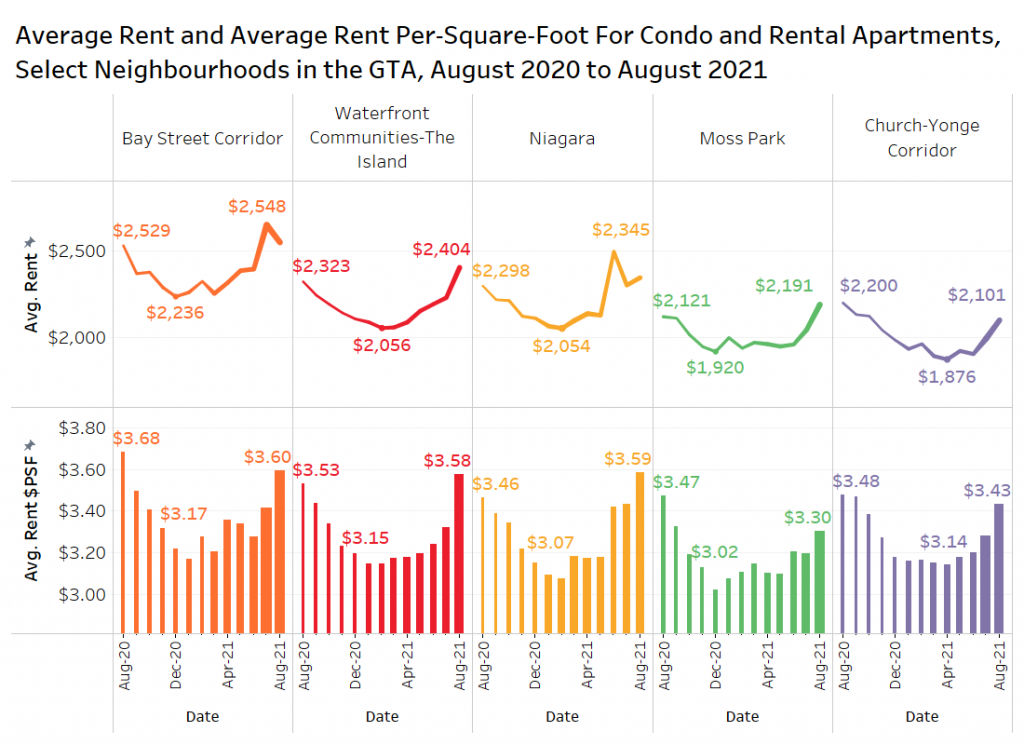
The average rental rate declined during the final months of 2020 and into early 2021 in the most popular neighbourhoods in the GTA. There is a distinct U-shape to the rental data in each of the markets. Several of the areas are above last August’s total, with the areas seeing rents increase by about $200 to $350 per month since the first quarter of this year.
In terms of the average rent per square foot, only the Waterfront Communities and Niagara are above the August 2020 rates.
The lack of new small investor-friendly condos in Vaughan west and Brampton results in low per-square-foot rents in that area. The best value markets in the 416 area code are in south Scarborough (M1M, M1E and M1C), as well as north Scarborough (M1V and M1X).
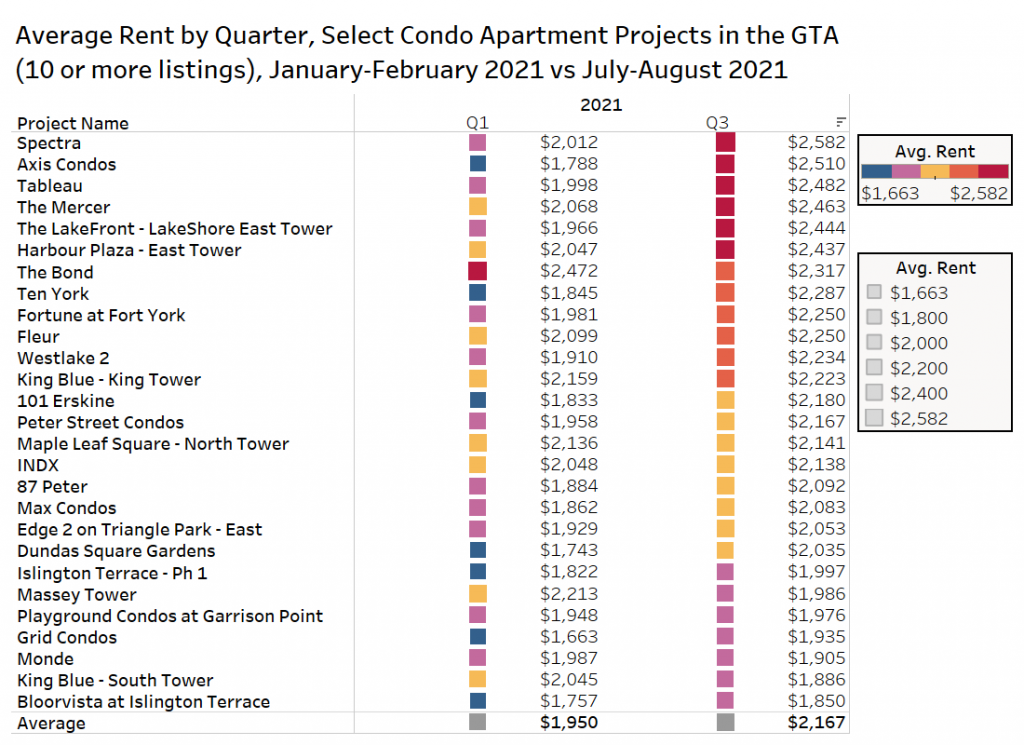
Rent Growth by Project
The figure below looks at the average rent for January and February only for condominium apartments in the GTA with 10 or more listings, compared to the same projects in July-August 2021.
Twenty-three of the 27 projects saw growth over the periods with an overall average growth of 11%.
The project with the highest growth was Axis Condos ($1,788 per month to $2,510 per month). This 38-storey building was completed in 2019 at 411 Church Street.
Conclusion
The rental market in the GTA continues to roar back, with monthly growth of 1.0%, 3.0%, and 0.9% in June, July, and August 2021. The growth was particularly strong for one-bedroom units, increasing 5.1% monthly.
Within the GTA, the areas experiencing the largest month-over-month increases in August 2021 include Ajax, Whitby, Scarborough, Richmond Hill, Milton, and Mississauga. On the neighbourhood level, a handful have shown strong signs of recovery, including Bay Street Corridor, Waterfront Communities, Niagara, Moss Park, and Church-Yonge Corridor.
For the best apples-to-apples comparison, we broke down the data on a project by project basis, which showed that many projects have experienced monthly increases, with select condo apartments showing an overall average increase of 11% when comparing the last two months of activity versus the first two months of the year.
Despite some concerns regarding the fourth wave, a return to normalcy continues in the GTA with colleges and universities opening up, as well as primary schools, malls, retail establishments, gyms and downtown office buildings. With all of these things happening, the GTA rental market is returning to normal, which typically includes monthly rent increases as demand outstrips supply.